
Auto Trendlines indicator
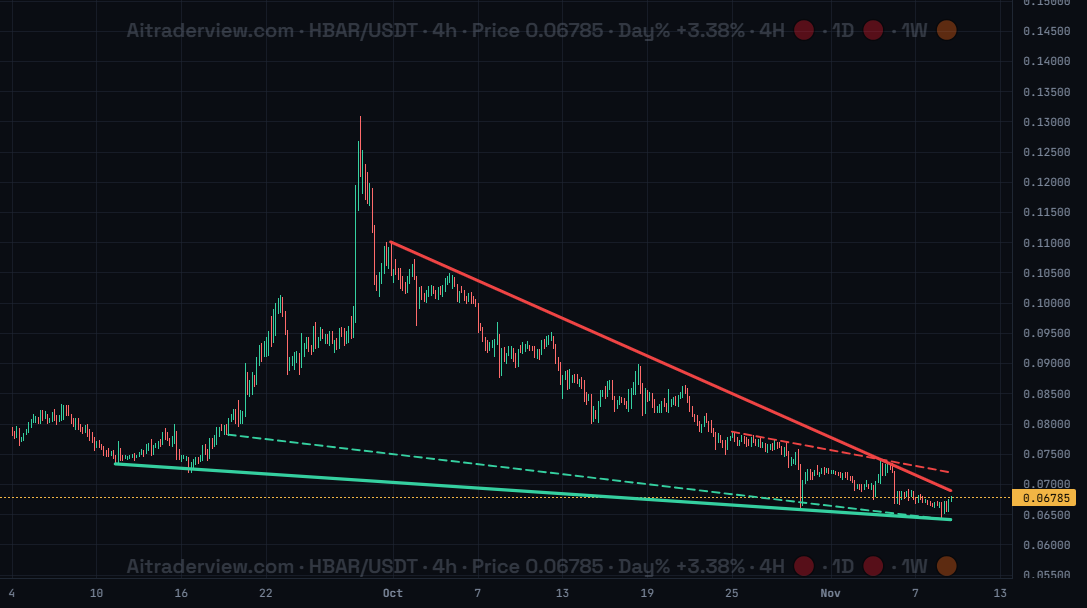
The screenshot shows HBAR/USDT on the 4h timeframe. The indicator has drawn a red resistance line over the falling highs and a green support line under the lows, plus a dashed secondary line for each.
1. Overview
| Property | Details |
|---|---|
| Indicator name | Auto Trendlines |
| Category | Trend |
| Type | Chart overlay (lines on the price chart) |
| Display | Up to two red resistance lines and up to two green support lines, the best ones solid and the secondary ones dashed |
| Data | Price candles of the timeframe you are viewing |
| Availability | Advanced indicator, off by default |
Trendlines connect swing highs or swing lows and show where price tends to meet resistance or support. Drawing them by hand takes time and different traders draw different lines. The Auto Trendlines indicator finds the best lines for you and draws them on the chart.
2. Purpose of the indicator
What does it measure?
It looks at swing highs and swing lows and tests combinations of two points. A line is only kept if no candle body breaks through it by more than a small tolerance and at least two candles touch it. The lines with the most touches and the longest length score highest, and the best ones are drawn up to the latest candle.
When do you use it?
- To see the main resistance and support lines without drawing them yourself.
- To recognise patterns such as falling wedges, rising wedges and channels.
- To spot a possible breakout when price leaves the lines.
- To compare your own drawn trendlines with the lines the indicator finds.
3. How to read the indicator
- Red line: resistance, drawn over swing highs. Price often struggles to close above it.
- Green line: support, drawn under swing lows. Price often bounces from it.
- Solid thick line: the best line of that side, based on the number of touches and its length.
- Dashed thin line: a secondary line with a clearly different slope, shown as an extra reference.
- Lines converge: when the red and green line move toward each other, as in the screenshot, a wedge or triangle is forming and a breakout gets closer.
- Lines can change: the lines are recalculated when new candles arrive, so a line can be replaced when price breaks it or a better one appears.
4. Settings
| Setting | Default | Description |
|---|---|---|
| Auto Trendlines | Off | Show or hide the automatically drawn trendlines on the price chart. There are no further settings. |
5. Tips and combinations
- Use the 4h and 1d timeframes for the clearest lines. On very low timeframes the lines change constantly.
- Auto lines are a starting point. A price that breaks a line with a closing candle is more meaningful than a short wick through it.
- Look at where the red and green line converge. The closer they get, the nearer a decision is.
- Draw your own lines with the Trendline tool and compare them with the automatic ones.
- Combine with the SMC indicator for structure breaks, the Squeeze indicator for compression, and the SuperTrend indicator for the trend direction.
6. Disclaimer
This indicator and its data are for information only and are not financial advice.
Watch the Crypto Cockpit intro video:
Watch all our videos via this link:
https://aitraderview.com/youtube-videos/
⚠️ RISK WARNING & AI DISCLOSURE
- This information is generated by Artificial Intelligence (AI) and complex algorithms. While advanced, these systems can contain errors or inaccuracies and are for educational purposes only.
- Technical analysis provides no guarantees; this information is purely informative.
- All discussed scenarios are hypothetical and do not constitute predictions or expectations.
- Past performance is not an indicator of future results.
- This is not financial advice and is not intended as a call-to-action for the reader.
- No implicit direction is claimed, and no specific behavior of market participants is suggested.