
Orderbook Heatmap indicator
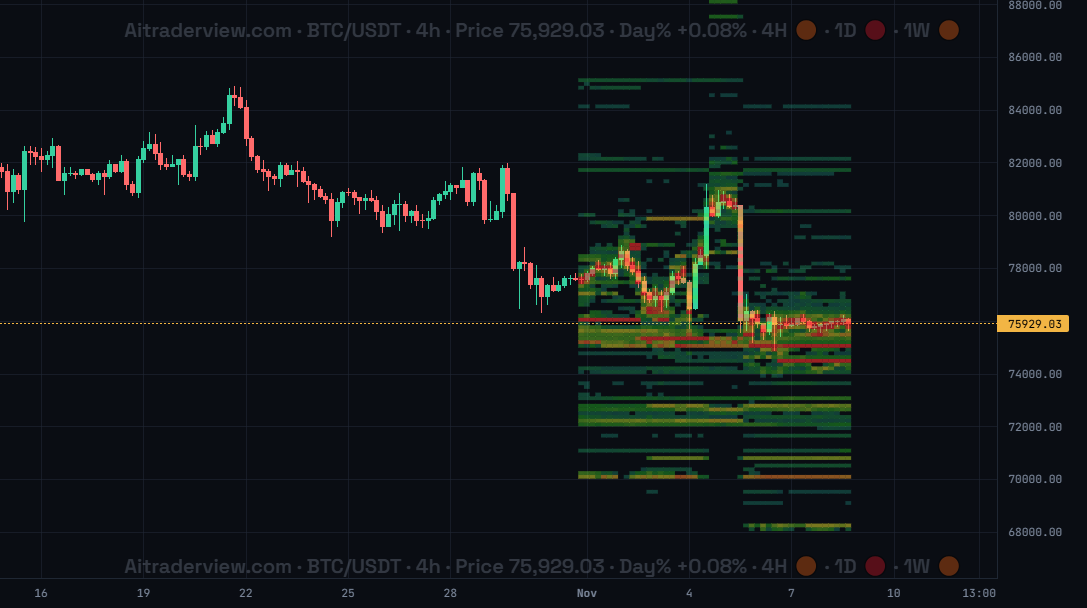
The screenshot shows BTC/USDT on the 4h timeframe with the Orderbook Heatmap switched on. Each colored column sits behind one candle.
1. Overview
| Property | Details |
|---|---|
| Indicator name | Orderbook Heatmap |
| Category | Liquidity |
| Type | Chart overlay (drawn behind the candles on the price chart) |
| Display | One column of colored cells behind every candle. Blue means little resting liquidity, green and yellow more, red the most. |
| Data | Orderbook snapshots of resting buy and sell orders, recent history only |
| Availability | Advanced indicator, off by default |
The Orderbook Heatmap shows where large amounts of limit orders were waiting in the orderbook while each candle was forming. Instead of only seeing the price, you see the liquidity around it: walls of resting orders that can act as support or resistance, and gaps where price can move quickly.
2. Purpose of the indicator
What does it measure?
It measures the volume of resting orders at each price level, per candle. Every cell is one price band in one candle. The color shows how much volume was waiting there compared with the rest of the visible chart.
When do you use it?
- To find liquidity walls near the current price that may stop or slow a move.
- To see whether large orders stay in place, or appear and vanish as price approaches.
- To spot thin areas where price can move fast because few orders are in the way.
- To confirm levels you already found with support and resistance, or with the Liquidation Heatmap.
3. How to read the indicator
- Bright yellow and red cells are price levels with a lot of resting volume. Treat them as liquidity walls.
- Blue and green cells hold less volume. Dark or empty areas have very little.
- A horizontal streak that continues over many candles is an order that stayed in the book for a long time.
- A cell that disappears as price comes close means the order was pulled or filled. Walls that vanish at the last moment are weaker than walls that hold.
- Colors are relative. They are scaled to the large volumes in the visible part of the chart, so a bright cell means “large for this view”, not a fixed number of coins.
- History is short. The heatmap only covers the most recent period (roughly the last week), so the columns start at a certain point in the chart instead of covering all candles.
4. Settings
| Setting | Default | Description |
|---|---|---|
| Orderbook Heatmap | Off | Show or hide the heatmap on the price chart. |
| Peak filter | Off | Only draw the strongest cells in each column (the top 20% by volume). This removes the background noise and leaves the biggest walls. |
5. Tips and combinations
- Switch on Peak filter when the chart looks crowded and you only want the biggest walls.
- Resting orders can be cancelled at any time. A wall is a hint, not a guarantee, so wait for price to react before trading it.
- Combine with the Liquidation Heatmap. Liquidation clusters show where positions would be forced out, the Orderbook Heatmap shows where orders are waiting. When both point at the same level, that level deserves extra attention.
- Compare columns over time: walls that keep coming back at the same price are more meaningful than a single spike.
6. Disclaimer
This indicator and its data are for information only and are not financial advice.
Watch the Crypto Cockpit intro video:
Watch all our videos via this link:
https://aitraderview.com/youtube-videos/
⚠️ RISK WARNING & AI DISCLOSURE
- This information is generated by Artificial Intelligence (AI) and complex algorithms. While advanced, these systems can contain errors or inaccuracies and are for educational purposes only.
- Technical analysis provides no guarantees; this information is purely informative.
- All discussed scenarios are hypothetical and do not constitute predictions or expectations.
- Past performance is not an indicator of future results.
- This is not financial advice and is not intended as a call-to-action for the reader.
- No implicit direction is claimed, and no specific behavior of market participants is suggested.