
Liquidation Heatmap indicator
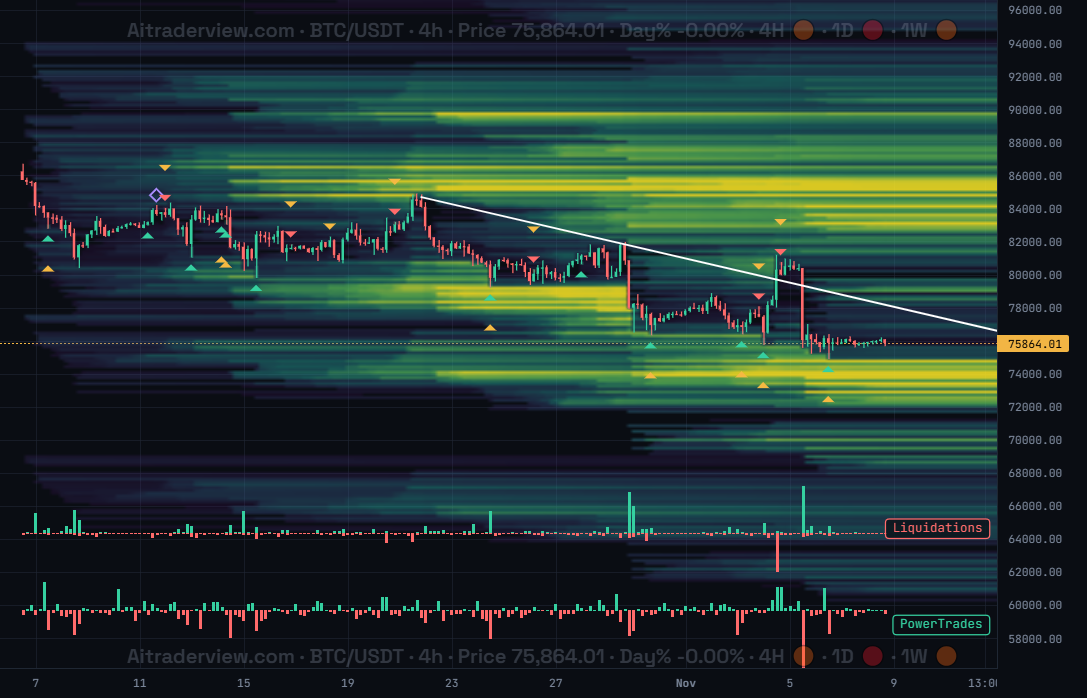
The screenshot shows BTC/USDT on the 4h timeframe with the Liquidation Heatmap on the price chart and the Liquidations and PowerTrades indicators below it.
1. Overview
| Property | Details |
|---|---|
| Indicator name | Liquidation Heatmap |
| Category | Derivatives / Liquidity |
| Type | Chart overlay (drawn behind the candles on the price chart) |
| Display | Horizontal bands of color by price level. Brighter bands mean more estimated liquidations. |
| Data | Open interest, trades and orderbook data from multiple exchanges |
| Availability | Advanced indicator |
The Liquidation Heatmap shows where leveraged positions are likely to be liquidated. Instead of a single line, you see bright bands at price levels where many longs or shorts would be forced out of their trades if price reaches them. These levels act like magnets, because price is often drawn to them and reacts when they are taken.
2. Purpose of the indicator
What does it measure?
It estimates how much leveraged positions are stacked at each price level. The default layer is built from new open interest per candle, spread over assumed leverage tiers, and removed once price crosses a level. It is an estimate, not a list of real positions.
When do you use it?
- To find likely targets above and below the current price.
- To see where price may bounce or stall after a level has been taken.
- To judge whether a move is heading into a dense cluster or into empty space.
- To place stops and take profits relative to the liquidity zones.
3. How to read the indicator
- Dark areas have little estimated liquidation liquidity.
- Green to yellow bands hold more liquidations. The brighter the yellow, the denser the cluster.
- Levels disappear once price has crossed them, because those positions are considered liquidated. This is why the map looks cleaner behind the current price.
- Clusters above price are mostly short liquidations. Clusters below price are mostly long liquidations.
- Price often reacts when it reaches a bright band, with a bounce, a stall or a fast sweep through it.
4. The power of three: Heatmap + Liquidations + PowerTrades
The screenshot uses the Liquidation Heatmap together with two pane indicators, and this combination works very well:
- Liquidation Heatmap (on the chart) shows where liquidations are expected.
- Liquidations (pane) shows the actual long (green) and short (red) liquidations as they happen. You can see when a level is really being taken. You can also draw the same histogram just above the x-axis of the chart with the Liquidations histogram option.
- PowerTrades (pane) counts the large individual trades in each candle, the kind of order that usually comes from big players instead of small retail traders.
A typical read: price approaches a bright cluster, a spike appears in the Liquidations pane when the level is taken, and PowerTrades shows whether large buyers or large sellers step in afterward.
5. Settings
| Setting | Default | Description |
|---|---|---|
| Estimated liquidation levels (heatmap) | On | The main heatmap built from open interest, leverage tiers and removal after a level is crossed. |
| Historical liquidations | Off | Shows actual executed liquidations from real trade data, binned by price and time. |
| Orderbook liquidity | Off | Shows current resting bid/ask depth from the orderbook. |
| Liquidations histogram | Off | Long and short liquidations histogram, drawn just above the x-axis. |
| model | v4 | v1 is the original model. v2 weights open interest in USD. v3 adds a flow-based long/short split, entries spread over the candle range and a mark price buffer. v4 runs v3 per exchange with the leverage tiers each venue allows and adds the results together. |
| exchanges (v4) | All | Choose which exchanges are included in the v4 heatmap. |
| leverage | all (5x–100x) | “high” keeps 25x and above and gives the visible clusters more vertical resolution. |
| brightness | relative | “relative” scales to the data in view. “% of OI” uses a fixed share of open interest, so brightness means the same across symbols and timeframes. |
6. Tips and combinations
- Use the 4h timeframe for the cleanest levels.
- Treat bright clusters as zones, not exact prices. Price can stop just before or sweep slightly through them.
- Switch to leverage “high” if the map looks too crowded.
- Use Historical liquidations to compare the estimate with what really happened.
- Combine with trend, support and resistance, and your own risk management. A level on its own is not a signal.
7. Disclaimer
This indicator and its data are for information only and are not financial advice.
Watch the Crypto Cockpit intro video:
Watch all our videos via this link:
https://aitraderview.com/youtube-videos/
⚠️ RISK WARNING & AI DISCLOSURE
- This information is generated by Artificial Intelligence (AI) and complex algorithms. While advanced, these systems can contain errors or inaccuracies and are for educational purposes only.
- Technical analysis provides no guarantees; this information is purely informative.
- All discussed scenarios are hypothetical and do not constitute predictions or expectations.
- Past performance is not an indicator of future results.
- This is not financial advice and is not intended as a call-to-action for the reader.
- No implicit direction is claimed, and no specific behavior of market participants is suggested.