
SuperTrend indicator
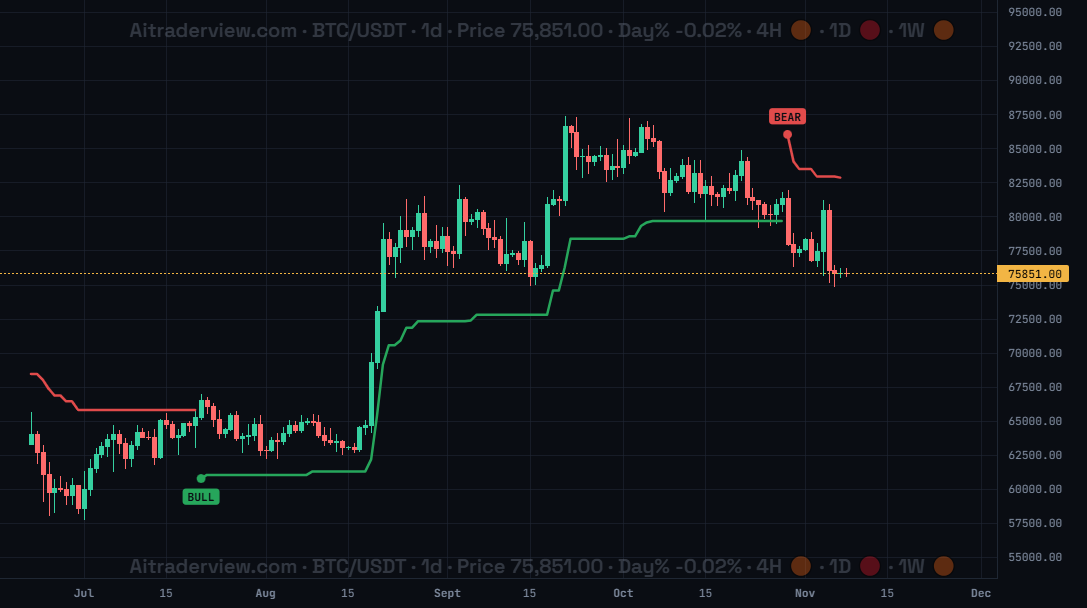
The screenshot shows BTC/USDT on the 1d timeframe with SuperTrend on. The green line runs below price in an uptrend, the red line above price in a downtrend, and BULL and BEAR markers show the trend changes.
1. Overview
| Property | Details |
|---|---|
| Indicator name | SuperTrend |
| Category | Trend |
| Type | Chart overlay (line on the price chart) |
| Display | One line that is green in an uptrend and red in a downtrend, with optional BULL and BEAR markers |
| Data | Price candles of the timeframe you are viewing |
| Availability | Basic indicator, off by default |
SuperTrend is a trend-following line based on the Average True Range (ATR). It follows price at a distance that depends on volatility. As long as price stays on the right side of the line the trend continues, and when price closes through it the trend flips.
2. Purpose of the indicator
What does it measure?
It measures the direction of the trend and gives a dynamic level that works like a trailing stop. In an uptrend the line sits below price, in a downtrend above price. There are two modes: Normal uses the standard SuperTrend (10, 3.0). Advanced adapts the distance to volatility (multiplier between 2.0 and 4.5) and adds an ADX filter and a Volume Profile confirmation.
When do you use it?
- To see at a glance whether the trend is up or down.
- To use the line as a dynamic support in an uptrend and a dynamic resistance in a downtrend.
- To place a trailing stop behind the trend.
- To get BULL and BEAR markers at the moment the trend flips.
3. How to read the indicator
- Green line below price: uptrend. The line rises with price and often acts as support.
- Red line above price: downtrend. The line falls with price and often acts as resistance.
- Flip: when price closes through the line, the trend changes and the line jumps to the other side of price, as in the screenshot where the red line turns into a green one in July.
- BULL marker: the trend flips up. BEAR marker: the trend flips down.
- Flat steps: the line only moves in the direction of the trend, so it often runs flat for a while.
- Advanced vs Normal: Advanced reacts with a distance that adapts to volatility, Normal always uses the same fixed settings.
4. Settings
| Setting | Default | Description |
|---|---|---|
| SuperTrend | Off | Show or hide the SuperTrend line on the price chart. |
| Normal | Off | Standard SuperTrend with period 10 and multiplier 3.0. |
| Advanced | On | Adaptive ATR multiplier (2.0 to 4.5) with an ADX filter and a Volume Profile confirmation. This mode is selected when you switch SuperTrend on. |
| Bull/Bear signals | On | Show BULL and BEAR markers when the trend changes. |
| Up color | #26a65b | Line color when the trend is up. |
| Down color | #e14b4b | Line color when the trend is down. |
| Line width | 2 (0.5 – 6) | Choose the thickness of the line. |
5. Tips and combinations
- Start with Advanced, the default mode when you switch SuperTrend on. Switch to Normal if you want the classic TradingView-style calculation.
- The 4h and 1d timeframes give the most reliable trend signals. On low timeframes the line flips often in sideways markets.
- SuperTrend works best in trending markets. In a sideways range expect several false flips.
- Use the line as a reference for a trailing stop, but remember that it is a guide and not a guarantee.
- Combine with the SMC indicator for structure breaks, the Squeeze indicator for compression before a move, and the EMA Trend indicator for extra trend confirmation.
6. Disclaimer
This indicator and its data are for information only and are not financial advice.
Watch the Crypto Cockpit intro video:
Watch all our videos via this link:
https://aitraderview.com/youtube-videos/
⚠️ RISK WARNING & AI DISCLOSURE
- This information is generated by Artificial Intelligence (AI) and complex algorithms. While advanced, these systems can contain errors or inaccuracies and are for educational purposes only.
- Technical analysis provides no guarantees; this information is purely informative.
- All discussed scenarios are hypothetical and do not constitute predictions or expectations.
- Past performance is not an indicator of future results.
- This is not financial advice and is not intended as a call-to-action for the reader.
- No implicit direction is claimed, and no specific behavior of market participants is suggested.