
Anchored VWAP indicator
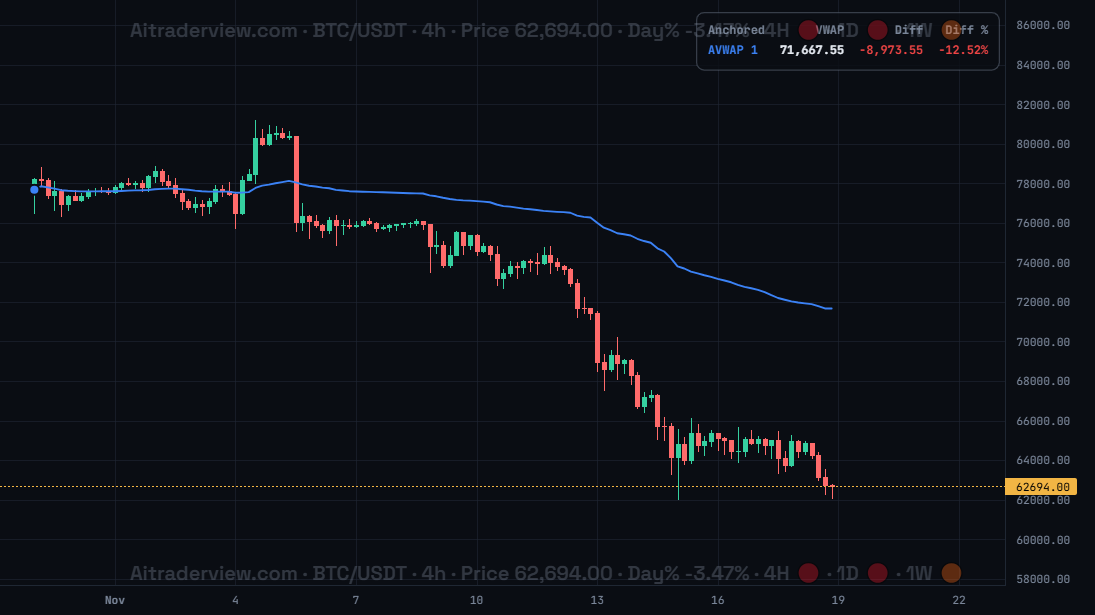
The screenshot shows Anchored VWAP for BTC/USDT on 4h: the blue line starts at the anchor dot on 1 November, and the table shows the VWAP at 71,667.55 and price 12.52% below it.
1. Overview
| Property | Details |
|---|---|
| Indicator name | Anchored VWAP |
| Category | Volume and VWAP |
| Type | Chart overlay (on the candles) |
| Display | A VWAP line from the anchor candle with a dot at the start, and an optional table |
| Data | Price and volume of the candles on the chart |
| Availability | Advanced indicator, off by default |
A normal VWAP restarts every session. An Anchored VWAP starts at a candle you choose, for example a big top, a bottom or a news event. It shows the average price, weighted by volume, that everyone paid since that moment. Price above the line means buyers since the anchor are in profit on average; below it they are at a loss.
2. Purpose of the indicator
What does it measure?
From the anchor candle onward it adds up the typical price ((high + low + close) / 3) times volume for every candle and divides it by the total volume. The line moves with every new candle. You can set up to 10 anchors per coin; each one gets its own line, numbered AVWAP 1, AVWAP 2 and so on. Anchors are saved per coin and stay after a reload.
When do you use it?
- To measure the average cost of everyone who bought since a top, bottom or event.
- To find dynamic support and resistance that moves with the market.
- To check if a trend since a key moment is still intact.
- To compare several anchors, for example from the last top and the last bottom.
3. How to read the indicator
- Dot: the anchor candle where the line starts.
- Blue line: the Anchored VWAP. In the screenshot it falls from about 78,000 to 71,667 as more volume trades at lower prices.
- Price above the line: buyers since the anchor are on average in profit; the line often acts as support.
- Price below the line: buyers since the anchor are on average at a loss; the line often acts as resistance, as in the screenshot.
- Table: for each anchor (AVWAP 1, AVWAP 2…) the VWAP value, the live difference to the price and the difference in percent. Green when price is above, red when it is below.
4. Settings
| Setting | Default | Description |
|---|---|---|
| Anchored VWAP | Off | Show or hide the Anchored VWAP lines. The options below appear when it is on. |
| Line | #3b82f6 / 1.5 | Colour and width of the line (0.5 to 6). |
| Show table | Off | Show a table with the VWAP value and the live price difference in value and percent. |
| Select anchor point | — | Turns on the Anchored VWAP tool. Then click a candle on the chart to start a new line there. The same tool is in the left toolbar. Right-click a line to remove it. |
| Remove anchor for this coin / Remove all anchors | — | Remove all anchors of the current coin, or of all coins at once. |
5. Tips and combinations
- Anchor on meaningful candles: a clear top or bottom, a breakout or a big news candle.
- Use two anchors, from the last top and the last bottom; price between them often means a sideways market.
- A retest of the line from above that holds is a classic place for a long; from below for a short.
- Combine with Session VWAP, Last Top/Bottom and Trend Structure.
6. Disclaimer
This indicator and its data are for information only and are not financial advice.
Watch the Crypto Cockpit intro video:
Watch all our videos via this link:
https://aitraderview.com/youtube-videos/
⚠️ RISK WARNING & AI DISCLOSURE
- This information is generated by Artificial Intelligence (AI) and complex algorithms. While advanced, these systems can contain errors or inaccuracies and are for educational purposes only.
- Technical analysis provides no guarantees; this information is purely informative.
- All discussed scenarios are hypothetical and do not constitute predictions or expectations.
- Past performance is not an indicator of future results.
- This is not financial advice and is not intended as a call-to-action for the reader.
- No implicit direction is claimed, and no specific behavior of market participants is suggested.