
Candlestick Patterns indicator
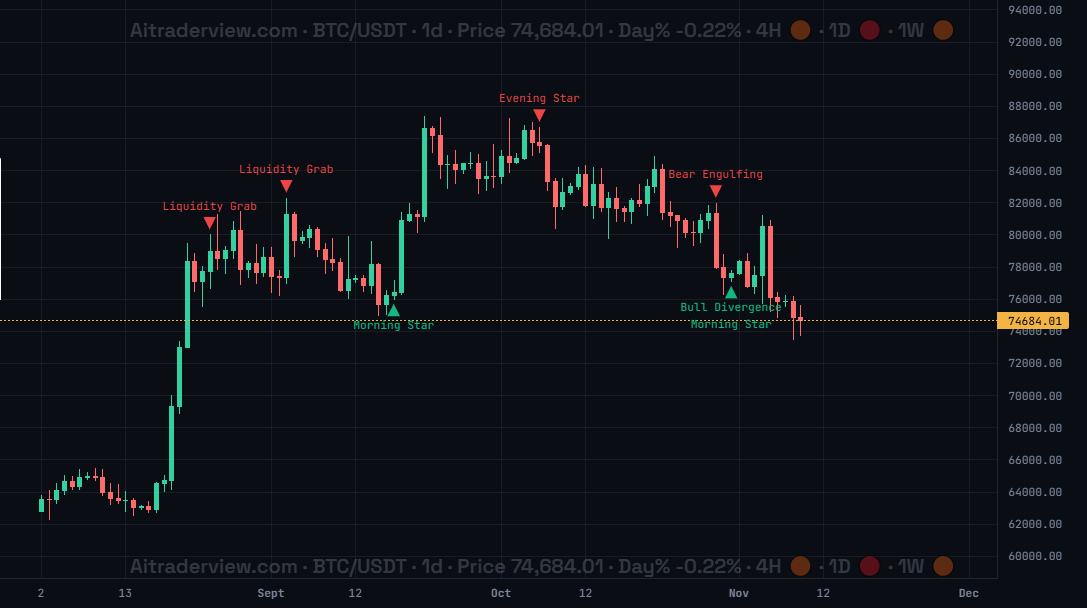
The screenshot shows BTC/USDT on the 1d timeframe with Candlestick Patterns Confirmed switched on. Green arrows below a candle are bullish patterns, red arrows above a candle are bearish patterns, each with the name of the pattern.
1. Overview
| Property | Details |
|---|---|
| Indicator name | Candlestick Patterns Confirmed / Candlestick Patterns Live |
| Category | Candlestick patterns |
| Type | Chart overlay (arrows and labels on the price chart) |
| Display | Confirmed: green (bullish) and red (bearish) arrows with the pattern name. Live: amber arrows with the pattern name |
| Data | Price candles of the timeframe you are viewing |
| Availability | Advanced indicators, off by default |
Candlestick patterns are shapes made by one or more candles that often point to a possible reversal or continuation. Spotting them by eye takes experience. Crypto Cockpit has two indicators that mark them automatically: Candlestick Patterns Confirmed and Candlestick Patterns Live.
2. Purpose of the indicator
What does it measure?
It detects well-known patterns such as Morning Star, Evening Star, Bull and Bear Engulfing, Tweezer Top and Bottom, Piercing, Three White Soldiers and Three Black Crows, plus Liquidity Grab, Bull Trap and divergence signals. Confirmed marks a pattern after it is complete. Live also looks at forming patterns, including Hammer, Inverted Hammer, Hanging Man, Shooting Star and the Doji variants, and shows them on the 4h and 1d timeframes.
When do you use it?
- To see possible reversal points at a glance instead of scanning every candle.
- To confirm a level or zone with a pattern at the same place.
- To learn the names of patterns by seeing them on your own chart.
- To check a forming candle on the 4h or 1d with the Live indicator before it closes.
3. How to read the indicator
- Confirmed, green arrow below a candle: a bullish pattern, for example Morning Star or Bull Divergence in the screenshot.
- Confirmed, red arrow above a candle: a bearish pattern, for example Evening Star, Bear Engulfing or Liquidity Grab.
- Live, amber arrow: a pattern found by the Live indicator. A label that ends with a question mark sits on the newest candle, which is still open, so the pattern can still disappear.
- Several patterns on one candle: the names are stacked under or above the arrow.
- Pattern plus level: a pattern means more when it appears at a support or resistance level, not in the middle of nowhere.
- No pattern is a promise: treat each marker as a signal to look closer and wait for the next candles to confirm.
4. Settings
| Setting | Default | Description |
|---|---|---|
| Candlestick Patterns Confirmed | Off | Show or hide the confirmed patterns on the price chart. |
| Candlestick Patterns Live | Off | Show or hide the live patterns. Works on the 4h and 1d timeframes. |
| Select all | – | Switch every pattern in the list on or off at once. |
| Pattern list | – | Choose which patterns are shown. In Confirmed, VSA Stop Volume, VSA Upthrust and Vol Divergence are off by default. |
5. Tips and combinations
- Start with Confirmed. It shows patterns that are complete, so there is less noise.
- Use Live on the 4h and 1d when you want an early warning, and remember that a label with a question mark can still change.
- The 4h and 1d timeframes give patterns that carry more weight than patterns on low timeframes.
- Hide patterns you do not use in the pattern list to keep the chart readable.
- Combine with the SMC indicator, Auto Trendlines and the Liquidation Heatmap to see whether a pattern appears at an important level.
6. Disclaimer
This indicator and its data are for information only and are not financial advice.
Watch the Crypto Cockpit intro video:
Watch all our videos via this link:
https://aitraderview.com/youtube-videos/
⚠️ RISK WARNING & AI DISCLOSURE
- This information is generated by Artificial Intelligence (AI) and complex algorithms. While advanced, these systems can contain errors or inaccuracies and are for educational purposes only.
- Technical analysis provides no guarantees; this information is purely informative.
- All discussed scenarios are hypothetical and do not constitute predictions or expectations.
- Past performance is not an indicator of future results.
- This is not financial advice and is not intended as a call-to-action for the reader.
- No implicit direction is claimed, and no specific behavior of market participants is suggested.