
Footprint indicator
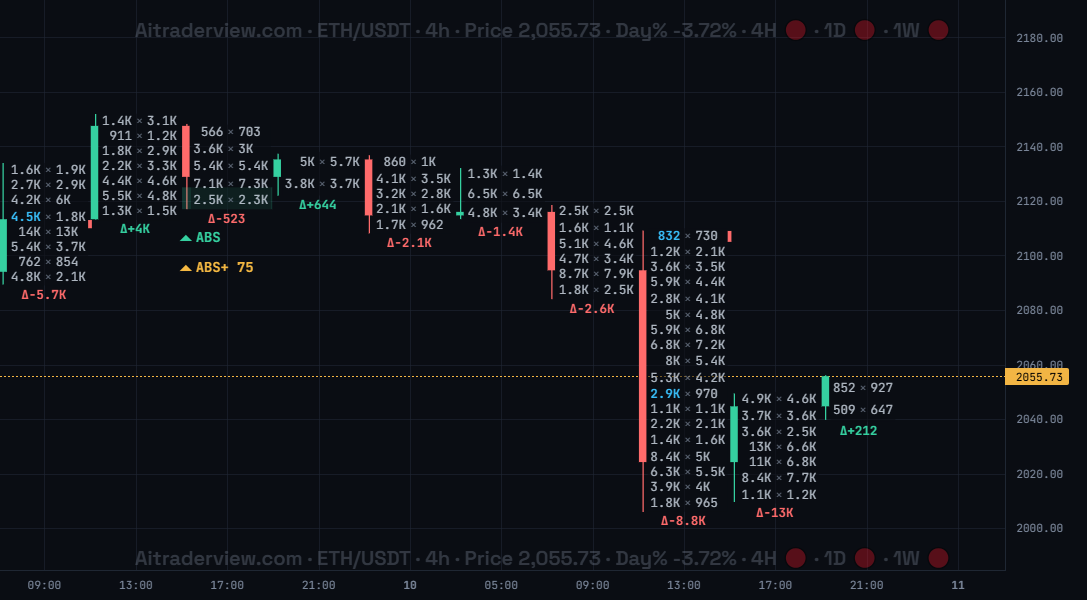
The screenshot shows the Footprint indicator for ETH/USDT on the 4h timeframe. Every candle shows the sold volume (bid) and bought volume (ask) per price level, with the delta below each candle and ABS / ABS+ markers.
1. Overview
| Property | Details |
|---|---|
| Indicator name | Footprint |
| Category | Volume and order flow |
| Type | Chart overlay (on the candles) |
| Display | Bid x Ask numbers per price level, delta, POC, value area and markers |
| Data | Executed trades per price level (4h and 1D only) |
| Availability | Advanced indicator, off by default |
A normal candle only shows open, high, low and close. The Footprint opens the candle and shows what traded inside it: at every price level you see how much was sold into the bid and how much was bought from the ask. This is order flow, and it shows who was really aggressive and where.
2. Purpose of the indicator
What does it measure?
For every price level inside a candle it shows the sold volume (bid, left) and the bought volume (ask, right) as Bid x Ask. From these numbers it derives the delta (ask minus bid), the Point of Control (POC, the level with the most volume), the value area that holds 70% of the volume, imbalances between neighbouring levels, unfinished auctions at the extremes, and absorption and exhaustion signals. It works on the 4h and 1D timeframes only.
When do you use it?
- To see who was aggressive inside a candle: buyers hitting the ask or sellers hitting the bid.
- To find the price levels where most volume traded (POC and value area).
- To spot absorption at a high or low, where big volume could not push price further.
- To check whether a high or low was a clean end of the move or an unfinished auction that price may return to.
3. How to read the indicator
- Bid x Ask numbers: the left number is the volume sold at that price level (bid), the right number is the volume bought (ask). Numbers are shortened, for example 1.4K.
- Blue numbers (imbalance): a number is coloured when one side is at least the set ratio (default 3, so 300%) larger than the opposite side one level diagonally away. It marks one-sided aggression.
- Stacked imbalances: three or more imbalances in a row on the same side are marked as a stack, which often acts as support or resistance.
- POC and value area: the POC is the level with the most volume in the candle, and the shaded value area holds 70% of the volume. When the POC stays at the same price on 2 or more consecutive candles it is marked as a Multiple HVN (Double/Triple), a strong support or resistance zone.
- Δ under the candle: the delta is ask minus bid for the whole candle. Green Δ+ means net buying, red Δ- means net selling. ΣΔ is the cumulative delta, a running sum that resets every UTC day (meaningful on 4h only).
- Unfinished auctions: when a high still has meaningful volume on the bid, or a low on the ask, price may return to finish it. A solid line stays open, a dashed line with a check mark was filled later.
- ABS: absorption. A big wick with outsized volume at the extreme that price failed to break through. ABS+ adds a score and is confirmed by a resting orderbook wall at the same price.
- EXH: exhaustion. Aggressive volume dries up at a fresh extreme, followed by a close away from it, which often signals a reversal.
4. Settings
| Setting | Default | Description |
|---|---|---|
| Footprint (4h/1D) | Off | Show or hide the Footprint on the chart. Works on 4h and 1D only. |
| Slim candles | On | Draws a slim candle so the Bid x Ask column stays readable. |
| Bid x Ask numbers | On | Shows the sold volume (bid, left) and bought volume (ask, right) at every price level. A font size setting (default 10) is next to it. |
| Imbalances | On | Colours the dominant side when one side is much larger than the opposite side one level diagonally away. The ratio setting is 3 by default (300%). |
| Stacked imbalances | On | Marks three or more imbalances in a row on the same side. |
| POC | On | Point of Control: the price level with the highest volume in the candle. |
| Multiple HVN (Double/Triple) | On | Marks when the POC lines up at the same price on 2 or more consecutive candles, a strong support or resistance zone. |
| Value Area (70%) | On | Shades the price range that holds 70% of the candle volume. |
| Delta per candle | On | Shows the net ask minus bid volume under every candle (green Δ+ or red Δ-). |
| Cumulative Delta (4h only) | On | Shows ΣΔ, a running sum of the delta that resets every UTC day. On 1D every candle is a day, so it equals the candle’s own delta. |
| Cumulative Delta Line (4h only) | Off | Draws the cumulative delta as a line on the chart, coloured by direction (rising = green, falling = red). |
| Unfinished auctions | On | Marks an extreme that still traded on the opposite side. A solid line is still open, a dashed line with a check mark was filled later. |
| Show table | Off | Shows a table with how many unfinished auctions were created, filled again and are still open. |
| Unfinished min. size | 15 % | How large the volume at the extreme must be, as a percentage of the average cell volume of the candle, before it counts as unfinished. |
| Absorption | On | Marks ABS: outsized volume at an extreme that price failed to break through. |
| Absorption Advanced | On | Marks ABS+ with a score: absorption confirmed by a resting orderbook wall at the same price, not just executed volume. |
| Exhaustion | On | Marks EXH: aggressor volume drying up at an extreme, followed by a reversal close. |
| Extreme lookback | 8 | Over how many previous bars the high or low must be a fresh extreme before exhaustion can be marked (1 to 50). |
| Tail volume | 50 % | The share of the expected volume at the extreme that may still trade. Lower means the volume must dry up more (5 to 100%). |
| Delta collapse | 35 % | How much the delta at the extreme must shrink compared with the delta just before it (0 to 100%). |
| Close within | 45 % | The close must be within this share of the candle range, measured from the opposite end, to count as a reversal close (10 to 50%). |
5. Tips and combinations
- Footprint only works on the 4h and 1D timeframes. Zoom in so the numbers stay readable, and lower the font size if the columns are crowded.
- Do not trade a single signal. An imbalance, ABS or EXH is stronger when it sits at a known support or resistance level.
- Look at the delta together with the candle colour: a green candle with a negative delta shows price rising on weak buying.
- Treat open unfinished auctions as levels price may revisit.
- Combine with the Liquidation Heatmap, Orderbook Heatmap, Npoc’s and the SMC indicator to find confirmation.
6. Disclaimer
This indicator and its data are for information only and are not financial advice.
Watch the Crypto Cockpit intro video:
Watch all our videos via this link:
https://aitraderview.com/youtube-videos/
⚠️ RISK WARNING & AI DISCLOSURE
- This information is generated by Artificial Intelligence (AI) and complex algorithms. While advanced, these systems can contain errors or inaccuracies and are for educational purposes only.
- Technical analysis provides no guarantees; this information is purely informative.
- All discussed scenarios are hypothetical and do not constitute predictions or expectations.
- Past performance is not an indicator of future results.
- This is not financial advice and is not intended as a call-to-action for the reader.
- No implicit direction is claimed, and no specific behavior of market participants is suggested.