
Liquidity Magnet indicator
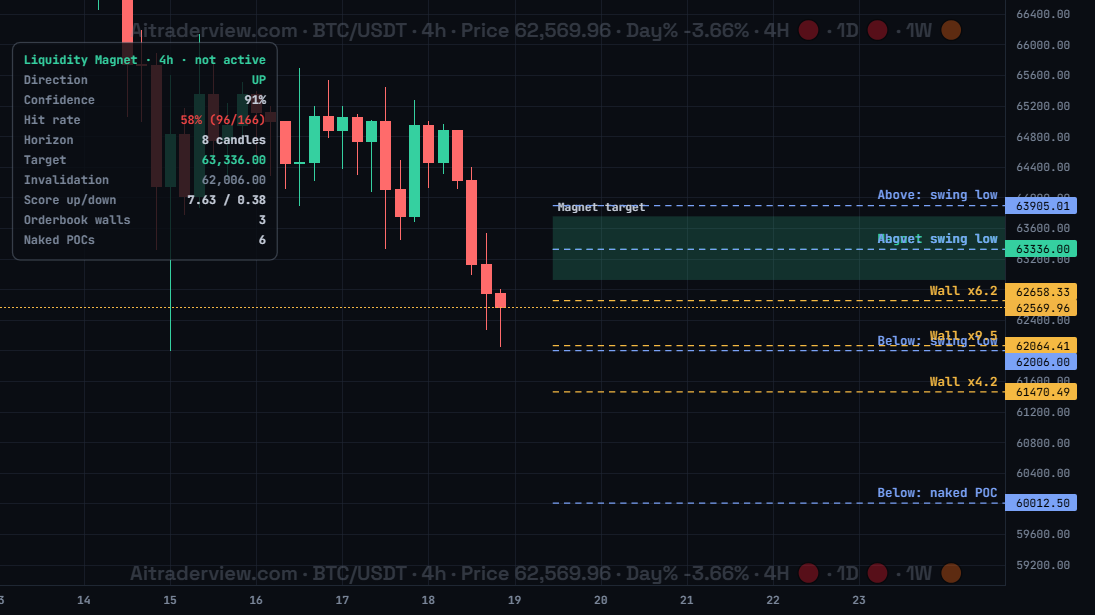
The screenshot shows Liquidity Magnet for BTC/USDT on 4h: the green magnet target zone, orderbook walls, the nearest swing levels and naked POC, and the table with direction UP and a hit rate of 58%.
1. Overview
| Property | Details |
|---|---|
| Indicator name | Liquidity Magnet |
| Category | Liquidity |
| Type | Chart overlay (on the candles) |
| Display | A target zone, dashed level lines with labels and a statistics table |
| Data | Candles, volume, open interest, liquidations, naked POCs and the orderbook |
| Availability | Advanced indicator, off by default |
Price is often drawn to places where many stop orders and liquidations sit. Liquidity Magnet looks at those liquidity zones above and below the price and predicts which one price will touch first. It also shows how often this prediction was right in the past.
2. Purpose of the indicator
What does it measure?
It collects liquidity levels around the price: recent swing highs and lows (where stops sit), weighted more when they came with high volume, rising open interest or large liquidations; naked POCs; and large orderbook walls. Levels close to the price count more. Walls between the price and a level make that level harder to reach. The side with the higher score gives the direction and the nearest level on that side becomes the magnet target. The indicator tests the same rule on the last 400 candles and shows the hit rate. It is only ACTIVE when the hit rate is at least 70% with at least 8 signals.
When do you use it?
- To see which liquidity level price is most likely to reach next.
- To find realistic targets for a trade.
- To spot large orderbook walls that can slow or stop the price.
- To judge how reliable the current signal is with the hit rate.
3. How to read the indicator
- Magnet target (green or red zone): the predicted level and a zone around it. Green when the direction is up, red when it is down. In the screenshot the target is a swing low at 63,336 above the price.
- Wall xN (yellow): a large orderbook wall. The number shows how many times bigger it is than an average orderbook level, for example Wall x9.5.
- Above / Below (blue): the strongest liquidity levels above and below the price, such as a swing low or a naked POC.
- Invalidation (grey): if price reaches this level first, the prediction has failed.
- Table: Direction, Confidence, Hit rate (hits/signals in the backtest), Horizon (number of candles the target should be reached in), Target, Invalidation, Score up/down and the number of orderbook walls and naked POCs.
- ACTIVE / not active: the title shows ACTIVE only when the backtest hit rate is 70% or higher. In the screenshot the hit rate is 58% (in red), so the signal is not active.
4. Settings
| Setting | Default | Description |
|---|---|---|
| Liquidity Magnet | Off | Show or hide the indicator. The options below appear when it is on. |
| Orderbook walls | On | Show the yellow orderbook wall lines. |
| Magnet target | Off | Show the predicted magnet target line and zone. |
| Invalidation | Off | Show the magnet invalidation line. |
| Nearest levels | Off | Show the nearest liquidity levels above and below price. |
| Zones | Off | Show the liquidity zones. |
| Headline label | Off | Show the headline label with direction and hit rate. |
| Show table | Off | Show the table with the magnet scores, target, invalidation and the backtested hit rate. |
5. Tips and combinations
- Trust the signal more when the title says ACTIVE. A red hit rate means the rule did not work well enough on this coin and timeframe.
- Use the Horizon: if the target is not reached within that number of candles, the idea has expired.
- Large walls between price and the target can slow the move. Watch them closely.
- Combine with Liquidation Heatmap, Orderbook Heatmap and Npoc’s to see the liquidity in more detail.
6. Disclaimer
This indicator and its data are for information only and are not financial advice.
Watch the Crypto Cockpit intro video:
Watch all our videos via this link:
https://aitraderview.com/youtube-videos/
⚠️ RISK WARNING & AI DISCLOSURE
- This information is generated by Artificial Intelligence (AI) and complex algorithms. While advanced, these systems can contain errors or inaccuracies and are for educational purposes only.
- Technical analysis provides no guarantees; this information is purely informative.
- All discussed scenarios are hypothetical and do not constitute predictions or expectations.
- Past performance is not an indicator of future results.
- This is not financial advice and is not intended as a call-to-action for the reader.
- No implicit direction is claimed, and no specific behavior of market participants is suggested.