
Last Top/Bottom indicator
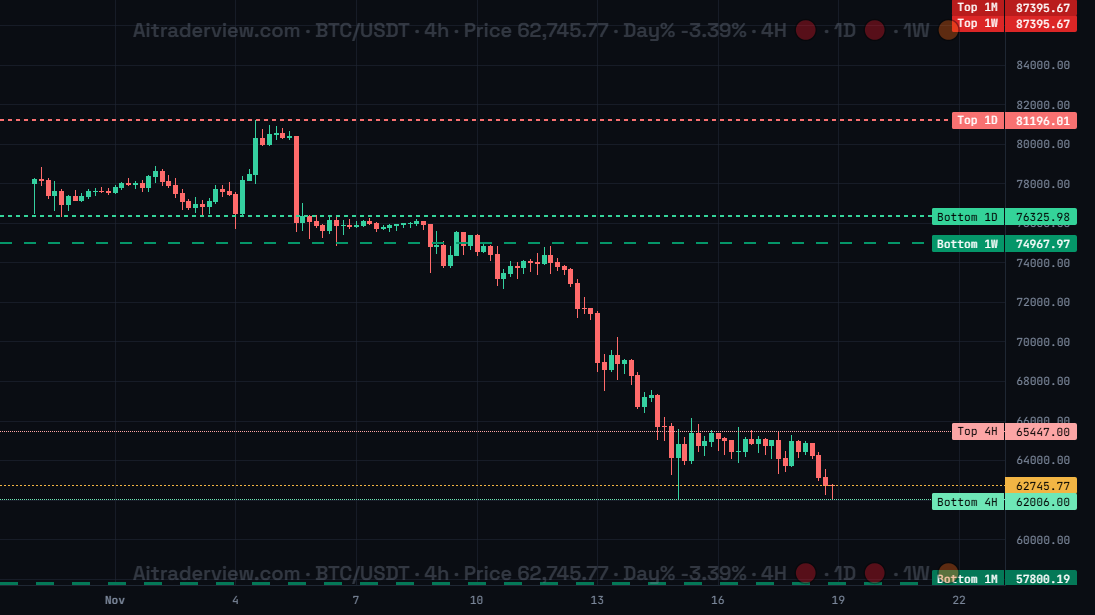
The screenshot shows Last Top/Bottom for BTC/USDT on 4h with the 4H, 1D, 1W and 1M levels turned on: red top lines above the price and green bottom lines below it.
1. Overview
| Property | Details |
|---|---|
| Indicator name | Last Top/Bottom |
| Category | Support and resistance |
| Type | Chart overlay (on the candles) |
| Display | Horizontal top and bottom lines per timeframe with labels, plus a stats table |
| Data | Candles of the chart timeframe and of 4H, 1D, 1W and 1M |
| Availability | Advanced indicator, off by default |
Last Top/Bottom marks the most recent confirmed top and bottom of the market. These levels are where the last swing turned, so they often act as resistance and support. You can show them for the chart timeframe and also for 4H, 1D, 1W and 1M at the same time.
2. Purpose of the indicator
What does it measure?
For each timeframe it looks back from the newest closed candle for the last swing high that is higher than the candles around it. That high only counts as a top when price has dropped a minimum percentage after it. The last bottom works the same way: the last swing low that is followed by a minimum rise. If no confirmed top or bottom is found, the highest high or lowest low of the period is used. The table shows how far the current price is from each level in percent.
When do you use it?
- To see where the last swing turned on several timeframes at once.
- To use the last top as resistance and the last bottom as support.
- To spot a trend change when price breaks the last top or bottom.
- To know how far price is from these levels in percent.
3. How to read the indicator
- Red line (Top): the last confirmed top. Labels show the timeframe: Last Top for the chart timeframe, or Top 4H, Top 1D, Top 1W and Top 1M.
- Green line (Bottom): the last confirmed bottom, labelled Last Bottom or Bottom 4H, 1D, 1W and 1M.
- Line style: each timeframe has its own line style, so you can tell the levels apart. Higher timeframes are usually the stronger levels.
- Screenshot: Bottom 4H at 62,006 sits just below the price, while Top 4H at 65,447 is the nearest resistance. The 1W and 1M tops are far above at 87,395.
- Stats table: lists every level with the distance of the current price in percent. Green means price is above the level, red means it is below.
4. Settings
| Setting | Default | Description |
|---|---|---|
| Last Top/Bottom | Off | Show or hide the indicator. The options below appear when it is on. |
| Chart timeframe | On | Show the last top and bottom of the timeframe shown on the chart. |
| 4H / 1D / 1W / 1M | Off | Always show the last top and bottom of that timeframe, regardless of the chart timeframe. |
| Show stats table | On | Show the table with the distance to the Last Top/Bottom levels on the main chart. |
5. Tips and combinations
- A close above the last top is a sign of strength; a close below the last bottom is a sign of weakness.
- Turn on 1D and 1W while trading on low timeframes to keep the bigger picture in view.
- When tops or bottoms of several timeframes are close together, that level is usually stronger.
- Combine with Trend Structure, Levels and Anchored VWAP (anchor on the last top or bottom).
6. Disclaimer
This indicator and its data are for information only and are not financial advice.
Watch the Crypto Cockpit intro video:
Watch all our videos via this link:
https://aitraderview.com/youtube-videos/
⚠️ RISK WARNING & AI DISCLOSURE
- This information is generated by Artificial Intelligence (AI) and complex algorithms. While advanced, these systems can contain errors or inaccuracies and are for educational purposes only.
- Technical analysis provides no guarantees; this information is purely informative.
- All discussed scenarios are hypothetical and do not constitute predictions or expectations.
- Past performance is not an indicator of future results.
- This is not financial advice and is not intended as a call-to-action for the reader.
- No implicit direction is claimed, and no specific behavior of market participants is suggested.