
Trend Structure indicator
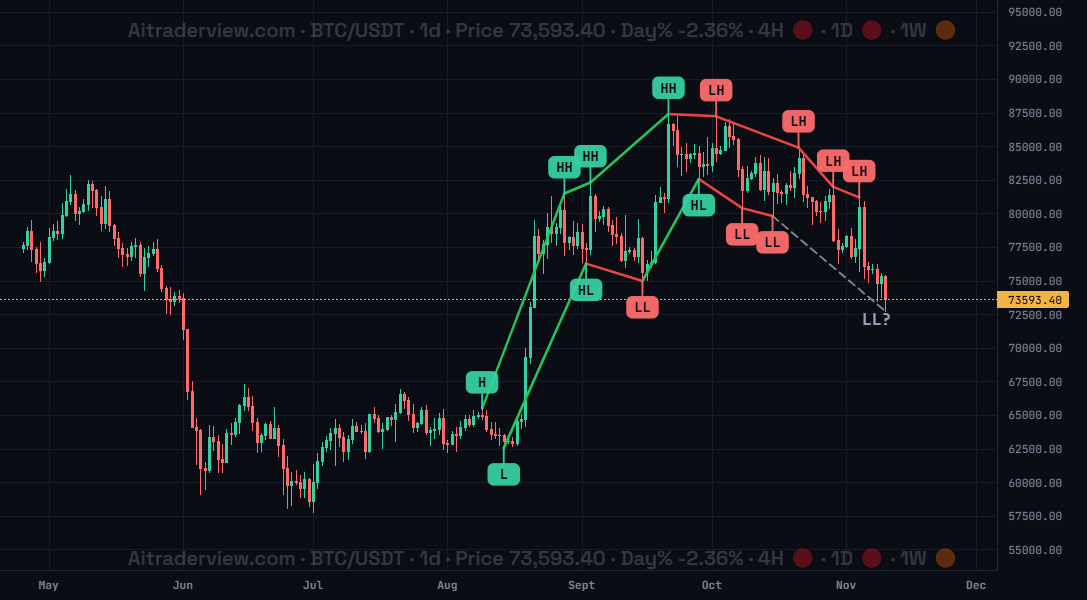
The screenshot shows the Trend Structure indicator for BTC/USDT on the 1d timeframe: green HH/HL labels during the uptrend, red LH/LL labels in the downtrend, connecting lines and a dashed candidate line with LL?.
1. Overview
| Property | Details |
|---|---|
| Indicator name | Trend Structure (HH/HL/LH/LL) |
| Category | Trend and structure |
| Type | Chart overlay (on the candles) |
| Display | Labelled swing points (HH, HL, LH, LL), connecting lines and a dashed candidate line |
| Data | Price candles (recent history of the selected timeframe) |
| Availability | Advanced indicator, off by default |
A trend is a sequence of swing highs and swing lows. In an uptrend each high and low is higher than the one before (HH and HL), in a downtrend each is lower (LH and LL). The Trend Structure indicator finds these swing points automatically, labels them and connects them, so you can see the market structure at a glance.
2. Purpose of the indicator
What does it measure?
It detects swing highs and swing lows on the recent candles of the selected timeframe. A swing point is a high or low that is the most extreme within five candles on each side. Each point is compared with the previous one of the same kind and labelled: HH (higher high), LH (lower high), EH (equal high), HL (higher low), LL (lower low) or EL (equal low). The first high and low are labelled H and L. Points within 0.1% of each other count as equal. The indicator also names the resulting pattern, such as Uptrend, Downtrend, Range, a triangle, a wedge or a broadening formation.
When do you use it?
- To see at a glance whether the market is in an uptrend, a downtrend or a range.
- To spot a possible trend change, for example when an uptrend prints its first LH or LL.
- To find the last swing high and low that act as support and resistance.
- To confirm the direction before you trade with another indicator.
3. How to read the indicator
- Green labels (H, HH, HL, L): the structure is making higher points. HH and HL together form an uptrend.
- Red labels (LH, LL): the structure is making lower points. LH and LL together form a downtrend.
- Amber labels (EH, EL): an equal high or low, within 0.1% of the previous one. Often seen in ranges.
- Connecting lines: the solid lines connect the swing highs with each other and the swing lows with each other, so you see the shape of the structure. In the screenshot the green lines follow the uptrend and the red lines the downtrend.
- Dashed line with a question mark (LL?): a provisional point. Price is approaching a new swing point that is not confirmed yet, because a swing needs candles on both sides. It can still change.
- Pattern name: the combination of the last high and low label gives a pattern: HH+HL Uptrend, LH+LL Downtrend, EH+EL Range, EH+HL Ascending Triangle, LH+EL Descending Triangle, LH+HL Symmetrical Triangle, HH+LL Broadening Formation, HH+EL Rising Wedge, EH+LL Falling Wedge.
- Trend change: when an uptrend stops making HH and HL and prints a LH and then a LL, the structure has turned down, as in the screenshot.
4. Settings
| Setting | Default | Description |
|---|---|---|
| Trend Structure (HH/HL/LH/LL) | Off | Show or hide the labelled swing points, connecting lines and pattern name on the chart. |
5. Tips and combinations
- Use it on 4h and 1d for the clearest structure. On very low timeframes there are many small swings.
- A swing point is only confirmed after candles on both sides, so the last labels can appear a little later. The ? labels are provisional.
- Trade with the structure: look for longs in HH and HL sequences and shorts in LH and LL sequences.
- Combine with the SMC indicator, Auto Trendlines, SuperTrend and the EMA Trend indicator to confirm the direction.
6. Disclaimer
This indicator and its data are for information only and are not financial advice.
Watch the Crypto Cockpit intro video:
Watch all our videos via this link:
https://aitraderview.com/youtube-videos/
⚠️ RISK WARNING & AI DISCLOSURE
- This information is generated by Artificial Intelligence (AI) and complex algorithms. While advanced, these systems can contain errors or inaccuracies and are for educational purposes only.
- Technical analysis provides no guarantees; this information is purely informative.
- All discussed scenarios are hypothetical and do not constitute predictions or expectations.
- Past performance is not an indicator of future results.
- This is not financial advice and is not intended as a call-to-action for the reader.
- No implicit direction is claimed, and no specific behavior of market participants is suggested.