
Options levels indicator
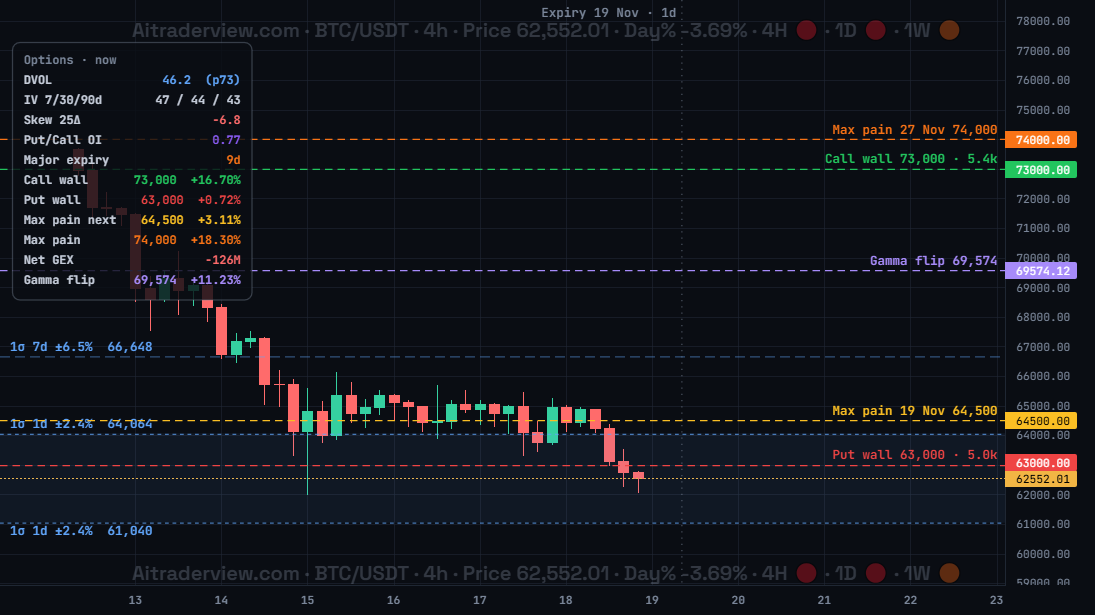
The screenshot shows Options levels for BTC/USDT on 4h: max pain for two expiries, the call wall and put wall, the gamma flip, the 1-day and 7-day expected move and the options table at the top left.
1. Overview
| Property | Details |
|---|---|
| Indicator name | Options levels |
| Category | Options and derivatives |
| Type | Chart overlay (on the candles) |
| Display | Horizontal option levels with labels, expiry lines, expected move bands and a table |
| Data | Crypto options market data (open interest, implied volatility, gamma) for BTC, ETH, SOL, XRP, HYPE, AVAX and TRX |
| Availability | Advanced indicator, off by default |
The options market often pulls the spot price toward certain levels, especially around expiry. Options levels draws the most important of these levels on your chart: max pain, the gamma flip, the call and put walls, the expiry dates and the expected move. It works for coins with a liquid options market: BTC, ETH, SOL, XRP, HYPE, AVAX and TRX.
2. Purpose of the indicator
What does it measure?
Max pain is the strike price at which most options would expire worthless; price often drifts toward it before a major expiry. The gamma flip is the price where dealer gamma changes from positive to negative: above it moves are often calmer, below it they can speed up. The call wall and put wall are the strikes with the most open call and put contracts up to the next major expiry and often act as resistance and support. The expected move is the 1-sigma price range implied by volatility for 1 day and 7 days. It shows the size of a likely move, not its direction.
When do you use it?
- To see where options can pull or hold the price before an expiry.
- To find support and resistance from the call wall and put wall.
- To know if the market is in a calm (above gamma flip) or fast (below gamma flip) regime.
- To size stops and targets with the expected move.
3. How to read the indicator
- Max pain (orange and yellow): one line for the next major expiry (here 27 Nov at 74,000) and, if it differs, one for the next expiry (here 19 Nov at 64,500).
- Call wall (green) and Put wall (red): the strikes with the most open contracts, with the size in thousands of contracts. Here 73,000 (5.4k) and 63,000 (5.0k).
- Gamma flip (purple): here 69,574. The price is below it, so moves can be faster.
- Expected move (blue): dashed lines for 1σ 1d (here ±2.4%, shaded) and 1σ 7d (here ±6.5%).
- Expiry markers: dotted vertical lines with the date and the number of days left, for example Expiry 19 Nov · 1d.
- Table: DVOL with its 1-year percentile (p73), IV 7/30/90d, Skew 25Δ, Put/Call OI, days to the major expiry, call wall, put wall, both max pain levels, Net GEX and gamma flip. The percentages show the distance from the current price.
4. Settings
| Setting | Default | Description |
|---|---|---|
| Options levels | Off | Show or hide the indicator. Only available for BTC, ETH, SOL, XRP, HYPE, AVAX and TRX. |
| Max pain | On | Draw the max pain level of the next major expiry (and of the next expiry when it differs). |
| Gamma flip | On | Draw the gamma flip level, where dealer gamma changes sign. |
| Expiry markers | On | Draw vertical lines at the next options expiry dates. |
| Expected move | Off | Draw the 1-sigma price range implied by volatility for 1 day and 7 days. Shows the size of the move, not the direction. |
| Call/put walls | Off | Draw the call wall and put wall: the strikes with the most open call and put contracts up to the next major expiry. |
| Show table | Off | Show a table with the current options statistics. |
5. Tips and combinations
- Max pain matters most in the last days before a major expiry. Far from expiry it has less pull.
- Below the gamma flip, use wider stops: moves can be larger and faster.
- Use the call wall and put wall as first targets or as places to take profit.
- A high DVOL percentile means options are expensive and the market expects big moves.
- Combine with Liquidation Heatmap and Quick S&R to see if option levels line up with other levels.
6. Disclaimer
This indicator and its data are for information only and are not financial advice.
Watch the Crypto Cockpit intro video:
Watch all our videos via this link:
https://aitraderview.com/youtube-videos/
⚠️ RISK WARNING & AI DISCLOSURE
- This information is generated by Artificial Intelligence (AI) and complex algorithms. While advanced, these systems can contain errors or inaccuracies and are for educational purposes only.
- Technical analysis provides no guarantees; this information is purely informative.
- All discussed scenarios are hypothetical and do not constitute predictions or expectations.
- Past performance is not an indicator of future results.
- This is not financial advice and is not intended as a call-to-action for the reader.
- No implicit direction is claimed, and no specific behavior of market participants is suggested.