
Volume Profile Advanced indicator
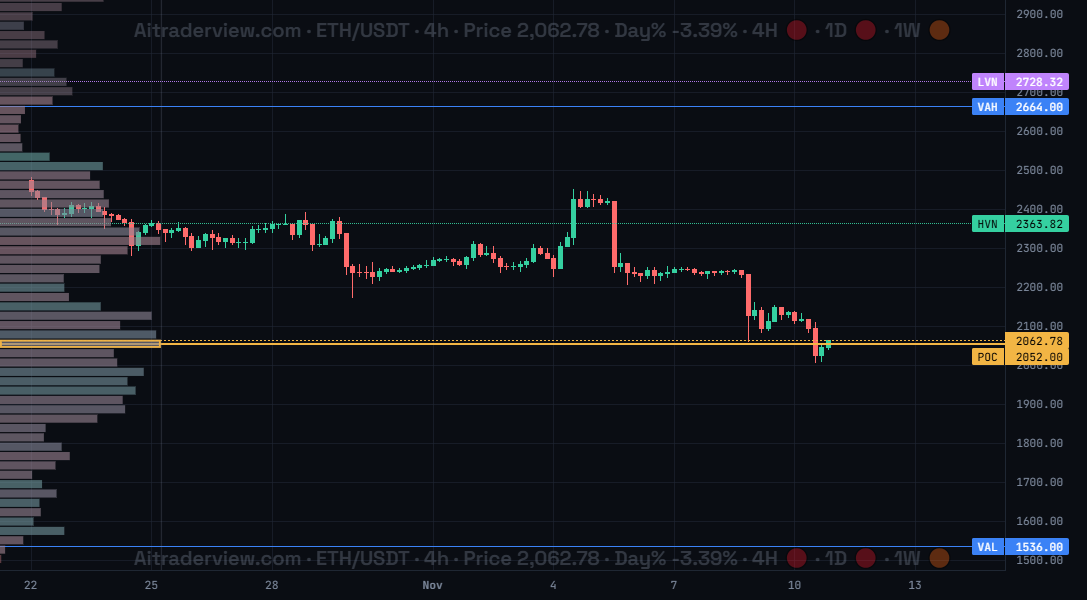
The screenshot shows the Volume Profile Advanced indicator for ETH/USDT on the 4h timeframe: the volume histogram on the left and the POC, VAH, VAL, HVN and LVN lines with their prices on the right axis.
1. Overview
| Property | Details |
|---|---|
| Indicator name | Volume Profile Advanced (VPad) |
| Category | Volume and order flow |
| Type | Chart overlay (on the candles) |
| Display | Volume histogram at the side of the chart and horizontal lines for POC, VAH, VAL, HVN and LVN |
| Data | Buy and sell volume per price bin over a chosen time window |
| Availability | Advanced indicator, off by default |
A Volume Profile shows how much volume traded at each price level, not at each moment in time. Prices with a lot of volume are accepted by the market and often act as magnets or support and resistance, prices with little volume are passed through quickly. Volume Profile Advanced draws this profile on your chart, colours it by buying and selling pressure, and marks the key levels for you.
2. Purpose of the indicator
What does it measure?
It splits the price range into bins and adds up the buy volume and sell volume traded in each bin over the chosen window. From that it derives the POC (Point of Control, the price with the most volume), the Value Area (the range holding 70% of the volume) with its upper edge VAH and lower edge VAL, the HVN (High Volume Node, a price with a lot of volume) and the LVN (Low Volume Node, a price with very little volume). The window is independent of the candle timeframe on the chart.
When do you use it?
- To find the prices where the market accepts value and where it does not.
- To get support and resistance levels based on real volume instead of drawn lines.
- To see whether buying or selling dominated at each price level.
- To spot thin areas (LVN) where price can move fast, and heavy areas (HVN) where it tends to stall.
3. How to read the indicator
- Histogram bars: the longer the bar, the more volume traded at that price. The bars are coloured by pressure: green where buying dominated, red where selling dominated, grey where it was balanced. Bars inside the Value Area are brighter.
- POC (orange): the price with the most volume, drawn as a solid line and an orange outline around its bar. Price is often pulled back to it. In the screenshot the POC is at 2052.00, right under the current price.
- VAH and VAL (blue): the upper and lower edge of the Value Area, which holds 70% of the volume. Price inside this range is in accepted value, price outside it is seen as expensive (above VAH) or cheap (below VAL).
- HVN (green, dotted): a High Volume Node, a price where a lot of volume traded. It often acts as support or resistance. If there are several, they are numbered HVN 1, HVN 2 and so on.
- LVN (purple, dotted): a Low Volume Node, a price with very little volume. Price tends to move through it quickly and it can act as a rejection or target level.
- Left or right: the histogram can sit on the left or on the right side of the chart.
4. Settings
| Setting | Default | Description |
|---|---|---|
| Volume Profile Advanced (VPad) | Off | Show or hide the volume profile with its key levels on the chart. Turning it on shows all lines. |
| VP window | Regime | The time window the profile is built over: 1D, 1W, 30D, 90D, 180D, 365D, Regime or All. It is independent of the candle timeframe. |
| VP: Left / Right | Left | Button that moves the histogram to the left or right side of the chart. |
| POC | On | Show the Point of Control line, the price with the most volume. |
| VAL | On | Show the lower edge of the Value Area. |
| VAH | On | Show the upper edge of the Value Area. |
| HVN | On | Show the High Volume Node lines. |
| LVN | On | Show the Low Volume Node lines. |
5. Tips and combinations
- Pick the window to match your trade: 1D or 1W for short term, 30D to 180D for swing trades, Regime or All for the big picture.
- Watch what price does at the POC, VAH and VAL: acceptance back inside the Value Area often leads to rotation toward the POC.
- Use LVNs as fast-move areas and as targets, and HVNs as places where price may stall or bounce.
- Combine with Session VWAP, Npoc’s, Automated Fibonacci and the Footprint indicator to confirm a level.
6. Disclaimer
This indicator and its data are for information only and are not financial advice.
Watch the Crypto Cockpit intro video:
Watch all our videos via this link:
https://aitraderview.com/youtube-videos/
⚠️ RISK WARNING & AI DISCLOSURE
- This information is generated by Artificial Intelligence (AI) and complex algorithms. While advanced, these systems can contain errors or inaccuracies and are for educational purposes only.
- Technical analysis provides no guarantees; this information is purely informative.
- All discussed scenarios are hypothetical and do not constitute predictions or expectations.
- Past performance is not an indicator of future results.
- This is not financial advice and is not intended as a call-to-action for the reader.
- No implicit direction is claimed, and no specific behavior of market participants is suggested.