
Zones indicator
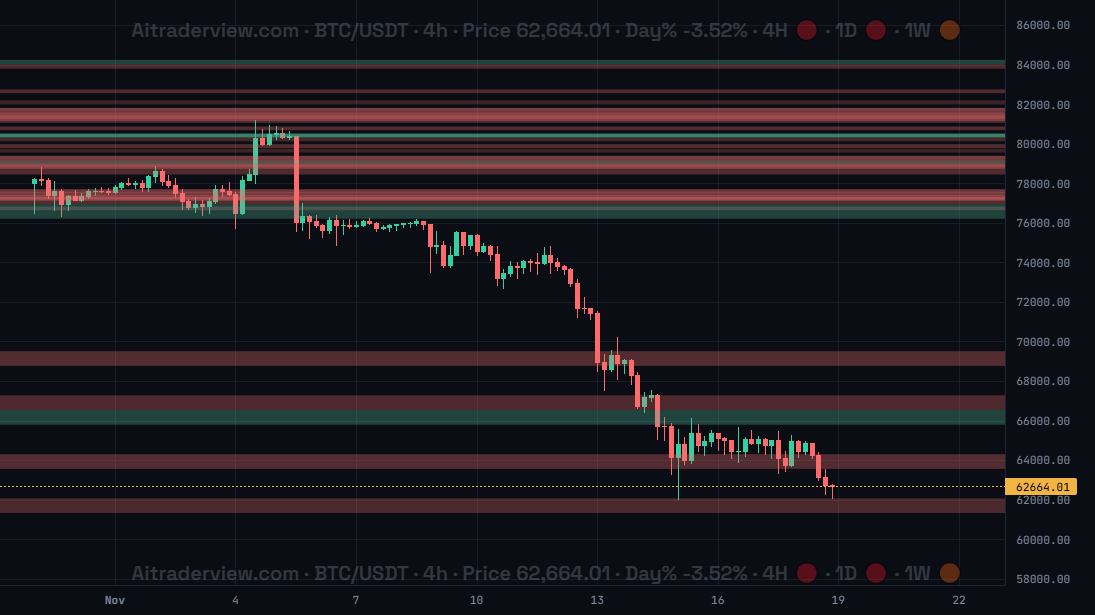
The screenshot shows Zones for BTC/USDT on 4h: red supply zones and green demand zones across the full chart width. Stronger zones are drawn darker.
1. Overview
| Property | Details |
|---|---|
| Indicator name | Zones |
| Category | Support and resistance |
| Type | Chart overlay (on the candles) |
| Display | Horizontal coloured bands across the chart (red supply, green demand) |
| Data | Supply and demand zones calculated by an AiTraderView machine learning model on several timeframes |
| Availability | Advanced indicator, off by default |
Zones shows supply and demand zones on the chart. A supply zone is a price area where selling pressure was unusually strong; a demand zone is an area where buying pressure was unusually strong. These areas often act as resistance and support when price comes back to them.
2. Purpose of the indicator
What does it measure?
The zones are calculated on the server by a machine learning model that looks for unusual price and volume behaviour (anomaly detection) on several timeframes. Each zone has a top price, a bottom price and an intensity. The indicator draws all zones of the coin at once, so you see the same zones on every candle timeframe. The intensity sets how dark a zone is drawn: the darker the band, the stronger the zone.
When do you use it?
- To find areas where price may stall or turn.
- To place take-profit just before a supply zone and stops beyond a demand zone.
- To see where strong buyers or sellers were active before.
- To confirm other support and resistance levels.
3. How to read the indicator
- Red band: a supply zone. When price rises into it, sellers may push it back down.
- Green band: a demand zone. When price falls into it, buyers may push it back up.
- Darker band: a stronger zone with a higher intensity. Faint bands are weaker.
- Stacked bands: several zones close together form a wide area of interest, as between about 76,000 and 82,000 in the screenshot.
- Price inside a zone: wait for a reaction. A clean close through the zone shows it was not strong enough this time.
4. Settings
| Setting | Default | Description |
|---|---|---|
| Zones | Off | Show or hide the supply and demand zones. There are no other settings. |
5. Tips and combinations
- Do not treat every zone as a trade. Use the darker, stronger zones first.
- Enter on a reaction at the zone, such as a rejection candle, not just because price touched it.
- Zones that line up with Levels, Quick S&R or Volume Profile Advanced are more meaningful.
- Turn Zones off when you do not need it: many bands can hide other indicators.
6. Disclaimer
This indicator and its data are for information only and are not financial advice.
Watch the Crypto Cockpit intro video:
Watch all our videos via this link:
https://aitraderview.com/youtube-videos/
⚠️ RISK WARNING & AI DISCLOSURE
- This information is generated by Artificial Intelligence (AI) and complex algorithms. While advanced, these systems can contain errors or inaccuracies and are for educational purposes only.
- Technical analysis provides no guarantees; this information is purely informative.
- All discussed scenarios are hypothetical and do not constitute predictions or expectations.
- Past performance is not an indicator of future results.
- This is not financial advice and is not intended as a call-to-action for the reader.
- No implicit direction is claimed, and no specific behavior of market participants is suggested.