
Levels indicator
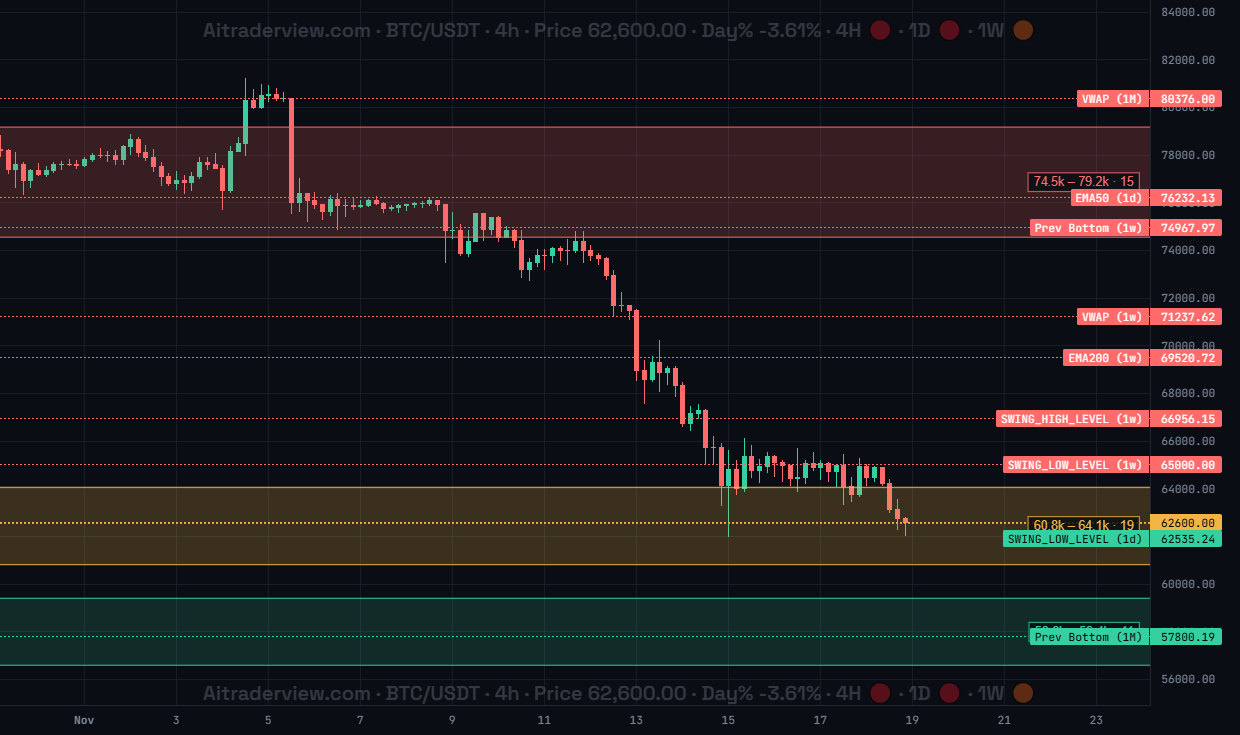
The screenshot shows Levels for BTC/USDT on 4h: pinned levels such as VWAP (1M), EMA50 (1d), Prev Bottom (1w) and SWING_LOW_LEVEL (1d), plus historical support and resistance zones with their score.
1. Overview
| Property | Details |
|---|---|
| Indicator name | Levels |
| Category | Support and resistance |
| Type | Chart overlay (on the candles) |
| Display | Dashed price lines with labels and shaded historical zones |
| Data | The levels of the Levels panel (moving averages, VWAPs, swings, previous tops and bottoms and more) and historical daily, weekly and monthly zones |
| Availability | Advanced indicator, off by default |
Levels puts the price levels you chose in the Levels panel on the chart. You pin the levels you care about, such as moving averages, VWAPs, swing highs and lows or previous tops and bottoms on several timeframes, and they appear as lines with a label. It also shows historical support and resistance zones and, if you want, the levels of a trader you follow.
2. Purpose of the indicator
What does it measure?
Every pinned level is drawn as a dashed line: red when it is above the current price (resistance) and green when it is below (support). The label shows the level type and its timeframe, for example EMA50 (1d). The levels you pick as main support and resistance are drawn as thick solid lines, and you can give each level its own colour and width. The historical zones are price areas where daily, weekly and monthly candles reacted many times. Their score is based on touches, bounces and volume; a higher score is drawn stronger. A zone is green below the price, red above and yellow when the price is inside it.
When do you use it?
- To keep your own key levels visible on every timeframe.
- To see support (green) and resistance (red) at a glance.
- To find strong historical zones where price reacted many times.
- To view the levels of a trader you follow next to your own.
3. How to read the indicator
- Red dashed line: a pinned level above the current price, a possible resistance. For example VWAP (1w) at 71,237.
- Green dashed line: a pinned level below the current price, a possible support. For example Prev Bottom (1M) at 57,800.
- Thick solid line: the level you chose as main support or resistance.
- Shaded zone with label: a historical zone, for example 60.8k – 64.1k · 19. The two prices are the bottom and top of the zone, the last number is its score.
- Zone colour: green below the price, red above and yellow when price is inside the zone, as in the screenshot where BTC trades inside 60.8k – 64.1k.
4. Settings
| Setting | Default | Description |
|---|---|---|
| Levels | Off | Show or hide the pinned levels and the historical zones. The first time you turn it on, the levels marked as important are pinned automatically. |
| Show levels of… | — | Choose a trader you follow to add their levels to the chart as an extra read-only layer. |
| Levels panel | — | In the Levels panel you pin or unpin levels, choose main support and resistance, set colour and width per level and filter the historical zones by timeframe, minimum score, maximum distance and side. |
5. Tips and combinations
- Pin only a handful of levels. Too many lines make the chart hard to read.
- Levels from higher timeframes (1w, 1M) are usually stronger than those from lower timeframes.
- When several levels and a historical zone sit close together, that area is often a strong reaction zone.
- Use a high minimum score in the Levels panel to show only the strongest historical zones.
- Combine with Quick S&R, Last Top/Bottom and Liquidity Magnet.
6. Disclaimer
This indicator and its data are for information only and are not financial advice.
Watch the Crypto Cockpit intro video:
Watch all our videos via this link:
https://aitraderview.com/youtube-videos/
⚠️ RISK WARNING & AI DISCLOSURE
- This information is generated by Artificial Intelligence (AI) and complex algorithms. While advanced, these systems can contain errors or inaccuracies and are for educational purposes only.
- Technical analysis provides no guarantees; this information is purely informative.
- All discussed scenarios are hypothetical and do not constitute predictions or expectations.
- Past performance is not an indicator of future results.
- This is not financial advice and is not intended as a call-to-action for the reader.
- No implicit direction is claimed, and no specific behavior of market participants is suggested.