
Range Detector indicator
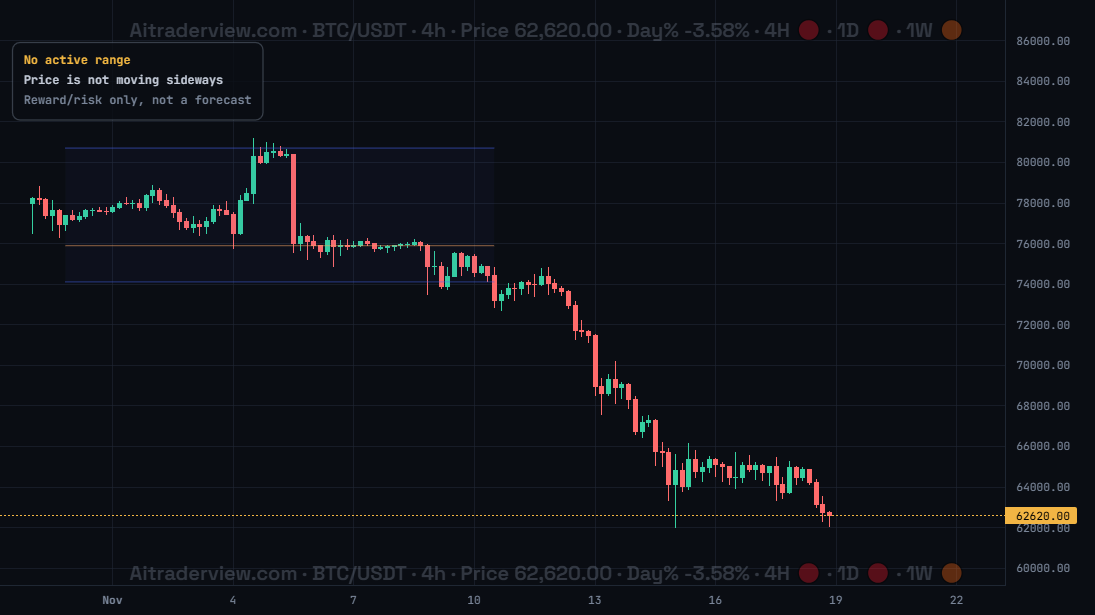
The screenshot shows Range Detector for BTC/USDT on 4h: a blue box marks an earlier sideways range with its top, low and POC line. Price has since broken down, so the table says No active range.
1. Overview
| Property | Details |
|---|---|
| Indicator name | Range Detector |
| Category | Trend and structure |
| Type | Chart overlay (on the candles) |
| Display | A shaded range box with range top, range low, POC and value area lines, plus a table |
| Data | Price and volume of the candles on the chart |
| Availability | Advanced indicator, off by default |
Markets often move sideways between a clear top and bottom. Range Detector finds these sideways ranges automatically from price and volume, draws them on the chart and tells you if entering at the current price gives a good reward compared to the risk. It is a reward/risk tool, not a price forecast.
2. Purpose of the indicator
What does it measure?
It scans windows of about 60 candles. Inside a window it builds a volume profile and uses it to set the range top and range low, the POC (most traded price) and the value area (70% of the volume). A window only counts as a range when about 90% of the closes stay inside, price touched both the top and the low at least twice, the height fits the recent volatility (ATR) and price did not drift too far. The range ends when a candle closes clearly above the top or below the low, or when price stops testing the edges. For an active range it checks where the price is: in the lower 30% it looks at a long, in the upper 30% at a short, with the POC as target and a stop just outside the range.
When do you use it?
- To spot sideways markets automatically.
- To trade the edges of a range instead of the middle.
- To check the reward/risk before you enter.
- To get a warning when a range breaks.
3. How to read the indicator
- Range box (blue): the area of the range, with Range top and Range low lines. An active range is brighter, past ranges are fainter.
- POC (orange): the most traded price in the range and the target of a range trade.
- Value area: thin lines that mark where 70% of the volume in the range was traded.
- Table: Top, POC, Low and Position (where the price is inside the range, 0% at the low and 100% at the top). In the lower or upper 30% it also shows Stop, Target and R:R.
- Verdict: Favorable R:R (long or short) when the target pays at least 1.5 times the risk, Not attractive when it pays less, Middle of range when the price is in the middle, Past the target when price is already beyond the POC, and No active range when price is not moving sideways, as in the screenshot.
4. Settings
| Setting | Default | Description |
|---|---|---|
| Range Detector | Off | Show or hide the indicator. The options below appear when it is on. |
| Show table | On | Show the table with the range levels, the position of the price in the range and the reward/risk verdict. |
| Show past ranges | Off | Also draw earlier ranges that have already ended. |
5. Tips and combinations
- Avoid trades in the middle of a range: the reward is small compared to the risk.
- Wait for price to reach the lower or upper 30% and look for Favorable R:R.
- A close outside the range ends it. Do not keep trading the old range after a breakout.
- Turn on Show past ranges to see how earlier ranges ended.
- Combine with Volume Profile Advanced, Squeeze and Trend Structure to judge if a breakout is coming.
6. Disclaimer
This indicator and its data are for information only and are not financial advice.
Watch the Crypto Cockpit intro video:
Watch all our videos via this link:
https://aitraderview.com/youtube-videos/
⚠️ RISK WARNING & AI DISCLOSURE
- This information is generated by Artificial Intelligence (AI) and complex algorithms. While advanced, these systems can contain errors or inaccuracies and are for educational purposes only.
- Technical analysis provides no guarantees; this information is purely informative.
- All discussed scenarios are hypothetical and do not constitute predictions or expectations.
- Past performance is not an indicator of future results.
- This is not financial advice and is not intended as a call-to-action for the reader.
- No implicit direction is claimed, and no specific behavior of market participants is suggested.