
AI Next 72h indicator
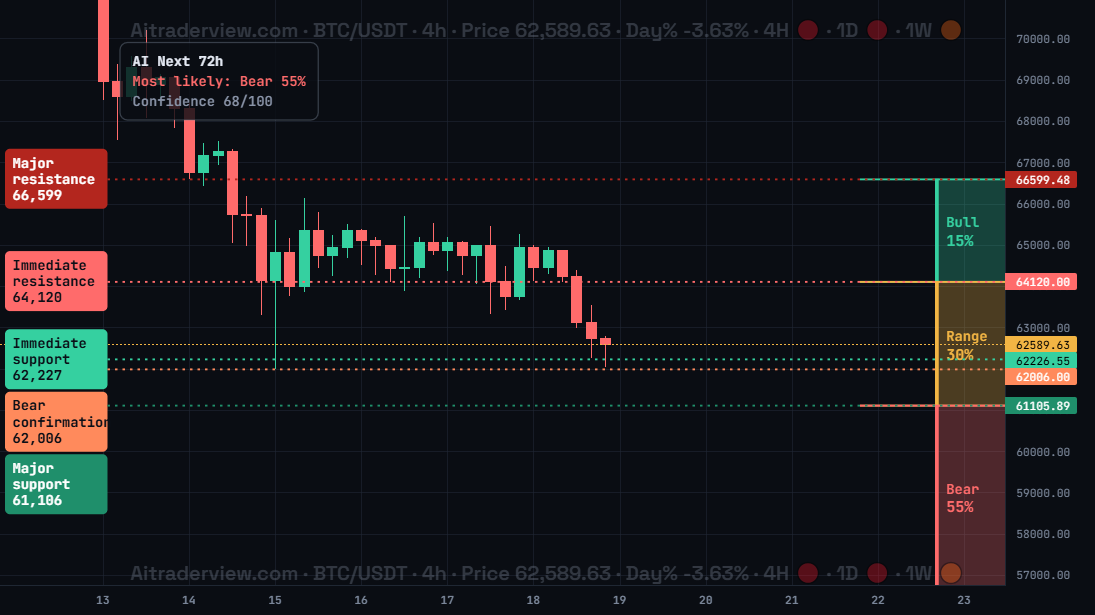
The screenshot shows AI Next 72h for BTC/USDT on 4h: Bull, Range and Bear zones on the right, five key levels on the left and the info card with Most likely: Bear 55%.
1. Overview
| Property | Details |
|---|---|
| Indicator name | AI Next 72h |
| Category | AI and forecasts |
| Type | Chart overlay (on the candles) |
| Display | Three probability zones, five dashed level lines with labels and an info card |
| Data | The AI 72H analysis of AiTraderView for Bitcoin and other supported coins |
| Availability | Advanced indicator, off by default |
AI Next 72h brings the AI 72H decision of AiTraderView directly onto the chart. You see which scenario the AI expects for the next 72 hours (bull, range or bear), how likely each scenario is, and the price levels that confirm or cancel it.
2. Purpose of the indicator
What does it measure?
It reads the latest AI 72H analysis for the coin on the chart. Each scenario has a price zone and a probability. The key levels mark where the scenario changes: major and immediate resistance above, immediate support, bear confirmation and major support below. The card shows the most likely scenario and the confidence score from 0 to 100. It is the same analysis for every timeframe, so the zones do not change when you switch the candle timeframe.
When do you use it?
- To see the expected direction for the next 72 hours at a glance.
- To know which levels confirm the bull or bear scenario.
- To plan stops and targets around the AI key levels.
- To check if your own trade idea agrees with the AI decision.
3. How to read the indicator
- Bull zone (green): the price area of the bull scenario with its probability. In the screenshot 15%.
- Range zone (yellow): the area where price is expected to move sideways. In the screenshot 30%.
- Bear zone (red): the price area of the bear scenario. In the screenshot 55%, the most likely scenario.
- Key levels (left labels): Major resistance (dark red), Immediate resistance (red), Immediate support (green), Bear confirmation (orange) and Major support (dark green), each with its price. The prices are also shown on the price axis.
- Info card: shows Most likely (here Bear 55%) and the Confidence score (here 68/100). A higher score means a clearer AI decision.
4. Settings
| Setting | Default | Description |
|---|---|---|
| AI Next 72h | Off | Show or hide the indicator. The options below appear when it is on. |
| Bull zone / Range zone / Bear zone | On | Show each probability zone separately. |
| Zone percentages | On | Show the probability percentages inside the zones. |
| Major resistance / Immediate resistance / Immediate support / Bear confirmation / Major support | On | Show or hide each key level line with its label. |
| Price axis labels | On | Show the level prices on the price axis. |
| Info card | On | Show the card with the most likely scenario and the confidence. |
5. Tips and combinations
- Use it as a guide for the next three days, not as a guarantee. Probabilities can change with each new analysis.
- Watch the Bear confirmation and Immediate resistance levels: a close beyond them shows which scenario is winning.
- A low confidence score means the AI sees no clear direction. Trade smaller or wait.
- Combine with Trend Structure, Quick S&R and Liquidity Magnet to time entries.
6. Disclaimer
This indicator and its data are for information only and are not financial advice.
Watch the Crypto Cockpit intro video:
Watch all our videos via this link:
https://aitraderview.com/youtube-videos/
⚠️ RISK WARNING & AI DISCLOSURE
- This information is generated by Artificial Intelligence (AI) and complex algorithms. While advanced, these systems can contain errors or inaccuracies and are for educational purposes only.
- Technical analysis provides no guarantees; this information is purely informative.
- All discussed scenarios are hypothetical and do not constitute predictions or expectations.
- Past performance is not an indicator of future results.
- This is not financial advice and is not intended as a call-to-action for the reader.
- No implicit direction is claimed, and no specific behavior of market participants is suggested.