
MuroTrend indicator
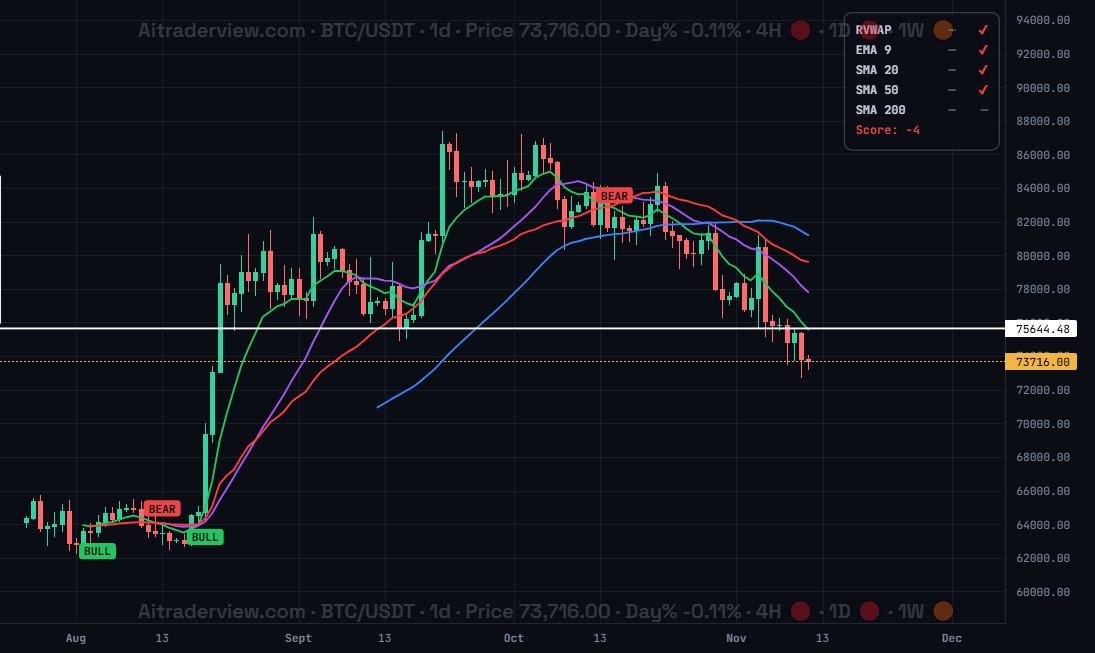
The screenshot shows the MuroTrend indicator for BTC/USDT on the 1d timeframe: four coloured moving averages, the Rolling VWAP, BULL and BEAR labels and the score table at the top right.
1. Overview
| Property | Details |
|---|---|
| Indicator name | MuroTrend |
| Category | Trend |
| Type | Chart overlay (on the candles) |
| Display | Four moving average lines, a Rolling VWAP line, BULL/BEAR labels and a score table |
| Data | Price and volume of the candles on the chart |
| Availability | Advanced indicator, off by default |
MuroTrend combines several trend tools in one overlay: a ribbon of four moving averages, a Rolling VWAP, a UT Bot trend filter, BULL and BEAR signals, and a small table that scores the trend. It gives you the direction of the market and the quality of the trend at a glance.
2. Purpose of the indicator
What does it measure?
It draws four configurable moving averages (by default EMA 9, SMA 20, SMA 50 and SMA 200) and a Rolling VWAP, a volume-weighted average price over a rolling time window. When the chosen moving average crosses the Rolling VWAP it can place a BULL (cross up) or BEAR (cross down) label. The UT Bot, an ATR trailing stop, acts as a filter so only signals that agree with its trend are shown. The table checks whether the price is above or below the Rolling VWAP and each of the four default averages and adds it up to a score from -5 to +5.
When do you use it?
- To see the trend direction and strength on one chart.
- To get BULL and BEAR entry ideas when an average crosses the Rolling VWAP.
- To keep only signals that agree with the UT Bot trend.
- To check at a glance how many of the key averages price is above or below, with the score.
3. How to read the indicator
- Moving average ribbon: by default EMA 9 (green), SMA 20 (purple), SMA 50 (blue) and SMA 200 (yellow). When price is above the averages and they fan out upward the trend is up, as the averages did in the screenshot from August to September. In the screenshot the averages turn down and sit above the price, a downtrend.
- Rolling VWAP (red): the average price weighted by volume over a rolling window. Price above it is seen as strong, price below it as weak.
- BULL and BEAR labels: BULL (green) appears when the chosen moving average crosses above the Rolling VWAP, BEAR (red) when it crosses below. With the UT Bot filter on, a label only appears when the UT Bot trend agrees.
- UT Bot markers: small circle markers show where the UT Bot trailing stop flips to buy (at the low) or sell (at the high).
- Table, columns: for each of RVWAP, EMA 9, SMA 20, SMA 50 and SMA 200 the left tick (green) means the close is at or above that line, the right tick (red) means the close is at or below it. A dash means no signal, for example when there are too few candles for the SMA 200.
- Score: every green tick adds +1, every red tick subtracts 1. A score of +3 or higher turns green (strong uptrend), -3 or lower turns red (strong downtrend). The screenshot shows Score: -4, a clear downtrend.
4. Settings
| Setting | Default | Description |
|---|---|---|
| MuroTrend | Off | Show or hide the MuroTrend overlay. The settings below appear when it is on. |
| MA #1 | On (EMA 9) | Show the first moving average. You can change its type (SMA, EMA, SMMA (RMA), WMA or VWMA), length and colour. Default: EMA 9, green. |
| MA #2 | On (SMA 20) | Show the second moving average, with the same type, length and colour options. Default: SMA 20, purple. |
| MA #3 | On (SMA 50) | Show the third moving average, with the same options. Default: SMA 50, blue. |
| MA #4 | On (SMA 200) | Show the fourth moving average, with the same options. Default: SMA 200, yellow. |
| Rolling VWAP | On (Auto) | Show the Rolling VWAP and choose its window: Auto, 30D, 90D or 365D. Auto picks a window that fits the timeframe: 1 day on 1h, 3 days on 4h, about 30 days on 1d, 90 days on 1w and 365 days on 1M. |
| UT Bot trailing stop | On (1.0 / 10) | Turns the UT Bot on. It is an ATR trailing stop with a key value (default 1.0) and an ATR period (default 10) that gives the trend used as signal filter. |
| UT Bot bull/bear markers | On | Shows small circle markers where the UT Bot flips to buy or sell. |
| BULL/BEAR labels | On (MA #1) | Shows BULL and BEAR labels when the chosen moving average (MA #1 to MA #4, default MA #1) crosses the Rolling VWAP. |
| Filter signals with UT Bot trend | On | Only shows BULL labels when the UT Bot trend is up and BEAR labels when it is down. |
| Show table | On | Shows the score table with the RVWAP, EMA 9, SMA 20, SMA 50 and SMA 200 checks and the total score. |
5. Tips and combinations
- Use it on 4h and 1d for the clearest trend. On low timeframes there are more false BULL and BEAR labels.
- Trade with the score: look for longs when the score is +3 or higher and for shorts when it is -3 or lower. A score near 0 means a mixed, sideways market.
- Keep the UT Bot filter on to remove signals that go against the trend.
- Remember that the SMA 200 needs enough candles. If its row shows dashes, increase the number of candles on the chart.
- Combine with Trend Structure, SuperTrend, SMC and Session VWAP to confirm the direction.
6. Disclaimer
This indicator and its data are for information only and are not financial advice.
Watch the Crypto Cockpit intro video:
Watch all our videos via this link:
https://aitraderview.com/youtube-videos/
⚠️ RISK WARNING & AI DISCLOSURE
- This information is generated by Artificial Intelligence (AI) and complex algorithms. While advanced, these systems can contain errors or inaccuracies and are for educational purposes only.
- Technical analysis provides no guarantees; this information is purely informative.
- All discussed scenarios are hypothetical and do not constitute predictions or expectations.
- Past performance is not an indicator of future results.
- This is not financial advice and is not intended as a call-to-action for the reader.
- No implicit direction is claimed, and no specific behavior of market participants is suggested.