
Quick S&R indicator
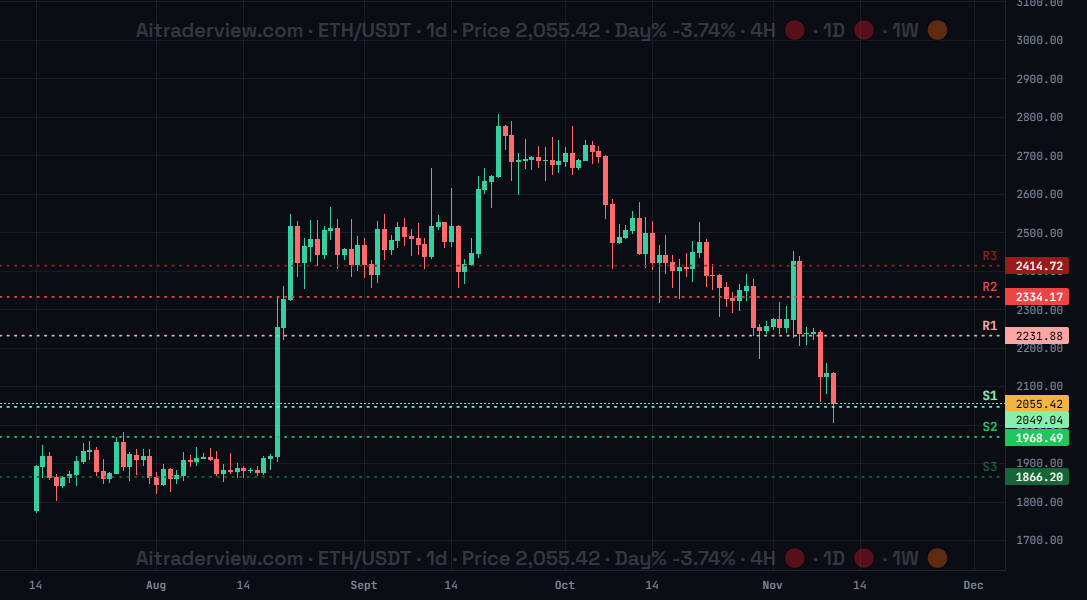
The screenshot shows the Quick S&R indicator for ETH/USDT on the 1d timeframe: dotted resistance lines R1 to R3 above the price (light red to dark red) and dotted support lines S1 to S3 below it (light green to dark green).
1. Overview
| Property | Details |
|---|---|
| Indicator name | Quick S&R |
| Category | Support and resistance |
| Type | Chart overlay (on the candles) |
| Display | Six dotted horizontal lines with labels R3, R2, R1, S1, S2 and S3 |
| Data | Pre-calculated support and resistance levels per coin |
| Availability | Basic indicator, off by default |
Support and resistance levels are prices where the market has a habit of pausing, bouncing or reversing. Quick S&R puts six of these levels on your chart in one click: three resistance levels above the price and three support levels below it. There is nothing to draw and nothing to configure.
2. Purpose of the indicator
What does it measure?
For the selected coin it shows three resistance levels (R1, R2, R3) and three support levels (S1, S2, S3). R1 and S1 are the levels closest to the price, R3 and S3 the furthest away. Each level is drawn as a dotted horizontal line across the chart with its label, and the price is also shown on the right axis in the same colour. The levels belong to the coin and are the same on every timeframe, and they refresh about every five minutes.
When do you use it?
- To get quick, ready-made support and resistance levels without drawing anything.
- To find nearby targets for a trade: R1 to R3 above the price, S1 to S3 below it.
- To place stops just beyond a support or resistance level.
- To see how far the price is from the next level.
3. How to read the indicator
- R1, R2, R3 (red): resistance levels above the price. The colour goes from light red (R1, closest) to dark red (R3, furthest). A level can stop or reverse a rise.
- S1, S2, S3 (green): support levels below the price. The colour goes from light green (S1, closest) to dark green (S3, furthest). A level can stop or reverse a drop.
- Dotted lines: every level runs across the whole chart. The label sits at the right side of the line, and the exact price shows on the right axis.
- Price between levels: in the screenshot ETH trades at the S1 area, with R1 above at 2231.88 and S2 below at 1968.49. If S1 breaks, the next support to watch is S2, then S3.
- Broken levels: when the price moves through a level, that level can turn from support into resistance or the other way around.
4. Settings
| Setting | Default | Description |
|---|---|---|
| Quick S&R | Off | Show or hide the six support and resistance lines on the chart. |
5. Tips and combinations
- Treat a level as a zone, not as an exact price. Price often reacts a little before or after the line.
- Look for a reaction at the level, such as a wick, a candle close or rising volume, before you act.
- Levels that line up with other tools are stronger: combine with Automated Fibonacci, Npoc’s, Session VWAP and the Liquidation Heatmap.
- Check the structure with the Trend Structure and SMC indicators to see whether a level is likely to hold or break.
6. Disclaimer
This indicator and its data are for information only and are not financial advice.
Watch the Crypto Cockpit intro video:
Watch all our videos via this link:
https://aitraderview.com/youtube-videos/
⚠️ RISK WARNING & AI DISCLOSURE
- This information is generated by Artificial Intelligence (AI) and complex algorithms. While advanced, these systems can contain errors or inaccuracies and are for educational purposes only.
- Technical analysis provides no guarantees; this information is purely informative.
- All discussed scenarios are hypothetical and do not constitute predictions or expectations.
- Past performance is not an indicator of future results.
- This is not financial advice and is not intended as a call-to-action for the reader.
- No implicit direction is claimed, and no specific behavior of market participants is suggested.