
Automated Fibonacci indicator
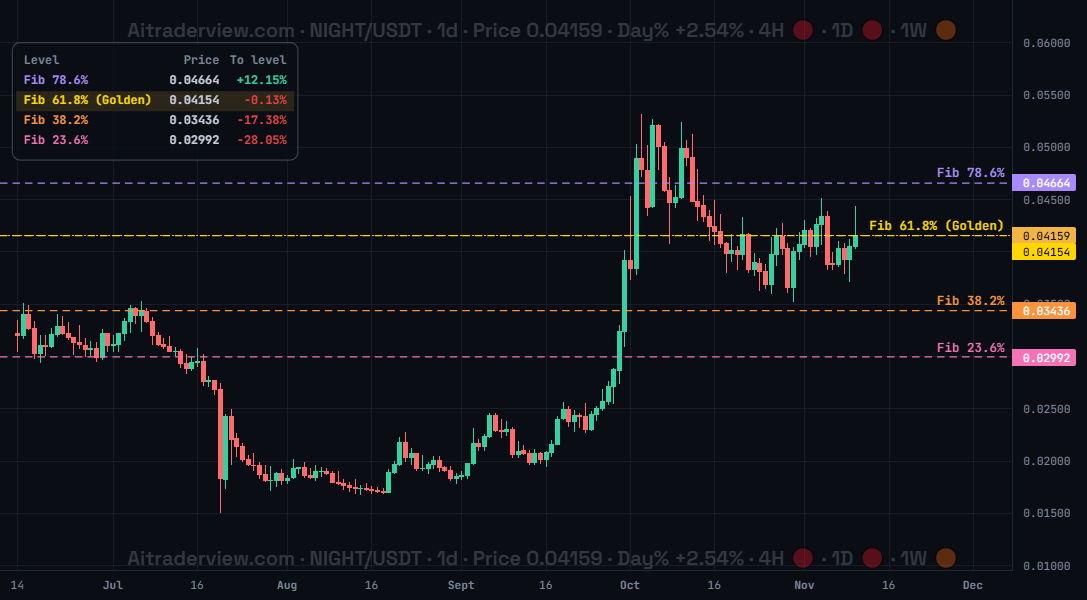
The screenshot shows the Automated Fibonacci indicator for NIGHT/USDT on the 1d timeframe: four coloured dashed levels (78.6%, 61.8% Golden, 38.2% and 23.6%) with the table in the top left showing the distance from the current price to each level.
1. Overview
| Property | Details |
|---|---|
| Indicator name | Automated Fibonacci |
| Category | Support and resistance |
| Type | Chart overlay (on the candles) |
| Display | Coloured dashed horizontal Fibonacci levels with labels and an optional table |
| Data | Latest swing high and swing low of the selected timeframe |
| Availability | Advanced indicator, off by default |
Fibonacci retracement levels are popular price levels between a swing low and a swing high, such as 23.6%, 38.2%, 50%, 61.8% and 78.6%. Traders watch them as possible support and resistance. Normally you draw them by hand. The Automated Fibonacci indicator draws them for you from the latest swing high and swing low, and keeps them up to date.
2. Purpose of the indicator
What does it measure?
It takes the latest swing high (100%) and swing low (0%) of the selected timeframe and calculates the Fibonacci levels in between. Optionally it also projects extension levels below the swing low (-23.6% to -100%) using the same range. Every level is drawn as a coloured dashed line across the chart with a label, and the data refreshes about every minute. The optional table lists each level with its price and the percentage the price still has to move to reach it.
When do you use it?
- To find possible support and resistance without drawing Fibonacci by hand.
- To see how far the price is from the next level, with the optional table.
- To look for entries and targets around the 61.8% Golden level and the 38.2% and 78.6% levels.
- To plan targets below the swing low with the extension levels.
3. How to read the indicator
- Dashed coloured lines: each line is a Fibonacci level with a label such as Fib 61.8% (Golden). The same colour is used for the price label on the right axis. In the screenshot 78.6% is purple, 61.8% gold, 38.2% orange and 23.6% pink.
- 100% (High) and 0% (Low): the latest swing high and swing low. The other levels sit between them as a share of that range.
- 61.8% (Golden): the best known level. Price often reacts strongly here, as a bounce zone in a pullback or as resistance in a bounce.
- 38.2% and 23.6%: shallow retracements, common in strong trends. 78.6% is a deep retracement where the trend is close to failing.
- Extension levels (-23.6% to -100%): projected below the swing low using the same range, useful as downside targets.
- Table: lists the levels from high to low with price and the “To level” percentage: the move needed from the current price (green means above the price, red means below). The level closest to the price is highlighted. In the screenshot the price sits on the Golden level (-0.13%).
4. Settings
| Setting | Default | Description |
|---|---|---|
| Automated Fibonacci | Off | Show or hide the Fibonacci levels on the chart. The level settings appear when it is on. |
| Show table | Off | Shows a table with all active levels, their price and the percentage needed from the current price. The nearest level is highlighted. |
| 100% (High) | Off | Show or hide the 100% (High) line. |
| 78.6% | On | Show or hide the 78.6% line. |
| 61.8% (Golden) | On | Show or hide the 61.8% (Golden) line. |
| 50% | Off | Show or hide the 50% line. |
| 38.2% | On | Show or hide the 38.2% line. |
| 23.6% | On | Show or hide the 23.6% line. |
| 0% (Low) | Off | Show or hide the 0% (Low) line. |
| Extension levels (-23.6% to -100%) | Off | Show or hide the extension levels below the swing low (-23.6%, -38.2%, -50%, -61.8%, -78.6% and -100%). |
5. Tips and combinations
- Use the 4h and 1d timeframes for the most reliable swing points. The levels follow the latest swing, so they can move when a new swing forms.
- Do not treat a level as a guarantee. Look for a reaction such as a wick, a candle close or volume at the level.
- Turn on the table to see at a glance which level is nearest and how far away it is.
- Confluence matters: a Fibonacci level that lines up with an Npoc, a liquidation cluster or a Premium/Discount zone is stronger.
- Combine with Trend Structure, SMC and Auto Trendlines to know the direction of the move you are retracing.
6. Disclaimer
This indicator and its data are for information only and are not financial advice.
Watch the Crypto Cockpit intro video:
Watch all our videos via this link:
https://aitraderview.com/youtube-videos/
⚠️ RISK WARNING & AI DISCLOSURE
- This information is generated by Artificial Intelligence (AI) and complex algorithms. While advanced, these systems can contain errors or inaccuracies and are for educational purposes only.
- Technical analysis provides no guarantees; this information is purely informative.
- All discussed scenarios are hypothetical and do not constitute predictions or expectations.
- Past performance is not an indicator of future results.
- This is not financial advice and is not intended as a call-to-action for the reader.
- No implicit direction is claimed, and no specific behavior of market participants is suggested.