
Exchanges Overview Spot CVD indicator
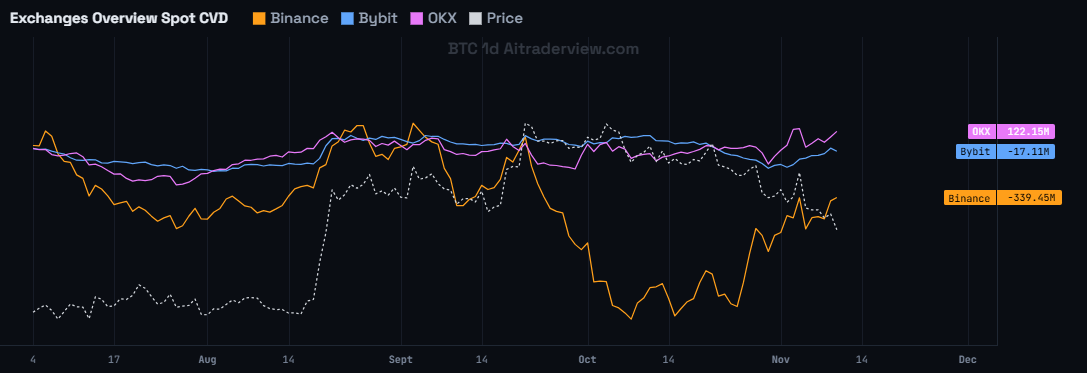
The screenshot shows the Exchanges Overview Spot CVD panel for BTC on the 1d timeframe. Each colored line is the spot CVD of one exchange, and the dashed white line is the price.
1. Overview
| Property | Details |
|---|---|
| Indicator name | Exchanges Overview Spot CVD |
| Category | Volume and order flow |
| Type | Pane indicator (separate panel below the chart) |
| Display | Three coloured lines (one per exchange) and a dashed price line |
| Data | Spot trade data of three large exchanges |
| Availability | Advanced indicator, off by default |
CVD stands for Cumulative Volume Delta. It adds up the difference between market buying and market selling over time. A rising line means buyers are more aggressive, a falling line means sellers are. This indicator draws the spot CVD of three large exchanges in one panel, so you can see where the buying and selling really comes from.
2. Purpose of the indicator
What does it measure?
For each exchange it adds up the spot delta of every candle into a running total. The three lines show whether net buying or net selling has built up on each exchange since the start of the loaded chart. The dashed line is the price of the coin on the same timeline.
When do you use it?
- To see which exchange is leading the buying or the selling.
- To check whether a price move is supported by spot buying or by spot selling.
- To spot a divergence between price and spot CVD, for example price rising while spot CVD falls.
- To see when exchanges disagree with each other.
3. How to read the indicator
- Rising line: net buying is building on that exchange. Falling line: net selling is building.
- Start at zero: every line starts at zero at the left edge of the loaded chart, so look at direction and slope, not at the absolute values. The last value of each line is shown on the right axis.
- Lines move together: when all exchanges rise or fall together, the move is broad and more reliable.
- Lines split: when one line falls while the others rise, that exchange is selling into strength or buying less than the others. In the screenshot one line drops strongly while the other two stay flat.
- Price against CVD: if price makes a new high but the spot CVD does not, buying power is not confirming the move, and the opposite for lows.
- Different scale: the CVD lines and the price line each have their own scale, so only the shape and direction can be compared.
4. Settings
| Setting | Default | Description |
|---|---|---|
| Exchanges Overview Spot CVD | Off | Show or hide this panel. You can choose in which panel it is shown. |
5. Tips and combinations
- Use the 4h and 1d timeframes for the clearest picture. Spot CVD on very low timeframes is noisy.
- Compare the direction of the lines with the price. A move that is not supported by spot CVD deserves more caution.
- Pay most attention when the exchanges disagree or when the lines turn together with a price turn.
- Remember that the lines start at zero on the left, so a different chart range gives different starting levels.
- Combine with the Divergences indicator (CVD Div), the Liquidation Heatmap and the SMC indicator to find confirmation.
6. Disclaimer
This indicator and its data are for information only and are not financial advice.
Watch the Crypto Cockpit intro video:
Watch all our videos via this link:
https://aitraderview.com/youtube-videos/
⚠️ RISK WARNING & AI DISCLOSURE
- This information is generated by Artificial Intelligence (AI) and complex algorithms. While advanced, these systems can contain errors or inaccuracies and are for educational purposes only.
- Technical analysis provides no guarantees; this information is purely informative.
- All discussed scenarios are hypothetical and do not constitute predictions or expectations.
- Past performance is not an indicator of future results.
- This is not financial advice and is not intended as a call-to-action for the reader.
- No implicit direction is claimed, and no specific behavior of market participants is suggested.