
BTC Correlation indicator
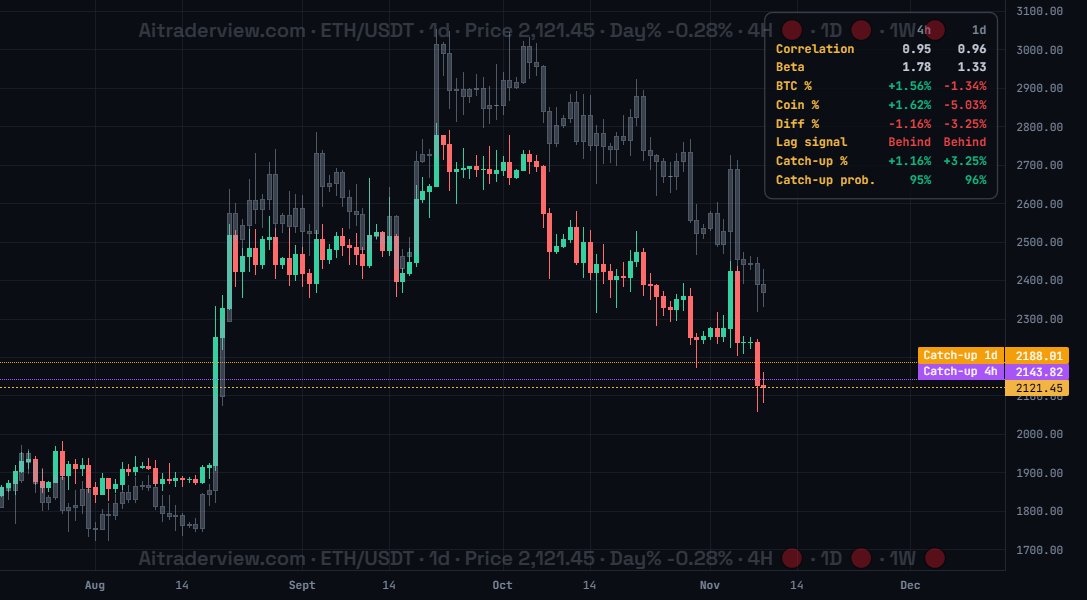
The screenshot shows ETH/USDT on the 1d timeframe with BTC Correlation on. The grey candles are Bitcoin, the table in the top right shows the statistics for 4h and 1d, and the two dotted lines on the right show the catch-up levels.
1. Overview
| Property | Details |
|---|---|
| Indicator name | BTC Correlation |
| Category | Correlation |
| Type | Chart overlay (grey Bitcoin candles, a statistics table and price lines) |
| Display | Grey Bitcoin candles, a stats table (4h and 1d) and two dotted Catch-up lines |
| Data | Price data of the coin and of Bitcoin |
| Availability | Basic indicator, off by default |
Most coins follow Bitcoin, but not always at the same speed. The BTC Correlation indicator shows how strongly your coin moves with Bitcoin, how big its moves are compared to Bitcoin, and whether the coin is lagging behind or running ahead.
2. Purpose of the indicator
What does it measure?
It compares the coin with Bitcoin on the 4h and 1d timeframes. Correlation tells how closely the two move together, and Beta tells how big the coin’s moves are compared to Bitcoin. From Bitcoin’s latest move and the Beta it calculates the move you would expect from the coin. The difference with the real move shows whether the coin is Behind, Ahead or In Sync, and how much it could catch up.
When do you use it?
- To see how strongly a coin depends on Bitcoin.
- To check whether a coin is lagging behind a Bitcoin move and might still follow.
- To judge whether a move in a coin is its own move or just Bitcoin’s move.
- To get a target level for a possible catch-up.
3. How to read the indicator
- Grey candles: Bitcoin, drawn over the chart on its own hidden scale and starting at the same point as your coin, so you can compare the shape of both moves.
- Correlation: a number up to 1. The higher it is, the closer the coin follows Bitcoin. In the screenshot ETH has 0.95 on 4h and 0.96 on 1d.
- Beta: above 1 means the coin moves more than Bitcoin, below 1 means less. ETH has 1.78 on 4h, so it moves almost twice as much as Bitcoin.
- BTC % and Coin %: the latest percentage change of Bitcoin and of the coin on that timeframe. Diff % is the real move minus the expected move.
- Lag signal: Behind (coin is lagging), Ahead (coin ran ahead) or In Sync. The signal only appears when the difference is larger than 0.5%.
- Catch-up % and prob.: how much the coin could still move to catch up, and the probability, which follows the correlation. Above 70% is green, 40 to 70% is amber, and below 40% is red.
- Catch-up lines: the purple 4h line and amber 1d line on the price chart show the price the coin would reach after that catch-up move.
4. Settings
| Setting | Default | Description |
|---|---|---|
| BTC Correlation | Off | Show or hide the grey Bitcoin candles on the chart. |
| Show stats table | On | Show the statistics table and the two Catch-up lines. The Catch-up lines only appear while the table is on. |
5. Tips and combinations
- Use it on altcoins. On Bitcoin itself the table has little meaning.
- A high correlation makes the catch-up signal more reliable. With a low correlation, the coin often goes its own way.
- Compare 4h and 1d: when both say Behind, the lag is more meaningful than when only one does.
- The catch-up level is an estimate and not a promise. Wait for a reaction at the line.
- Combine with the SuperTrend indicator or the SMC indicator to confirm that the coin is ready to move.
6. Disclaimer
This indicator and its data are for information only and are not financial advice.
Watch the Crypto Cockpit intro video:
Watch all our videos via this link:
https://aitraderview.com/youtube-videos/
⚠️ RISK WARNING & AI DISCLOSURE
- This information is generated by Artificial Intelligence (AI) and complex algorithms. While advanced, these systems can contain errors or inaccuracies and are for educational purposes only.
- Technical analysis provides no guarantees; this information is purely informative.
- All discussed scenarios are hypothetical and do not constitute predictions or expectations.
- Past performance is not an indicator of future results.
- This is not financial advice and is not intended as a call-to-action for the reader.
- No implicit direction is claimed, and no specific behavior of market participants is suggested.