
Divergences indicator
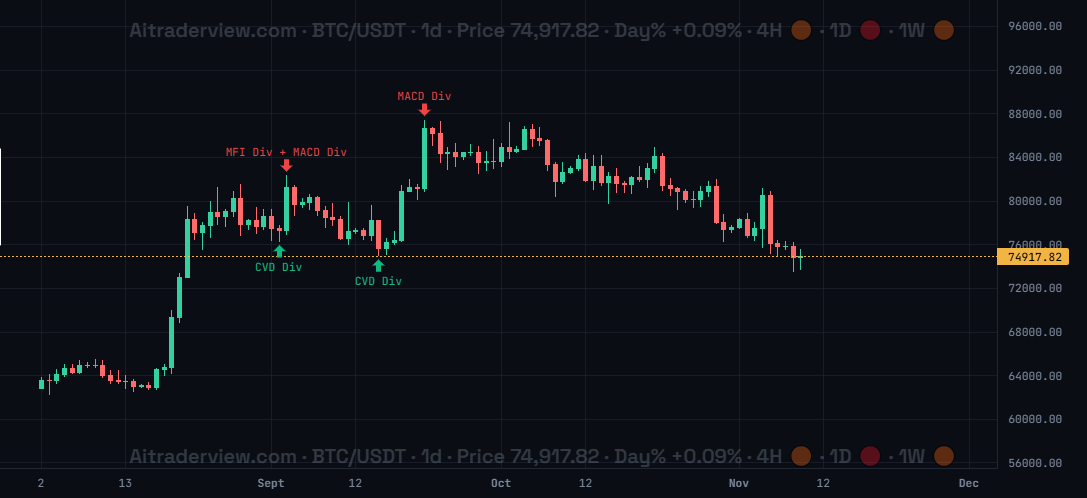
The screenshot shows BTC/USDT on the 1d timeframe with Divergences switched on. Green arrows below a candle are bullish divergences (here CVD Div) and red arrows above a candle are bearish divergences (here MACD Div and MFI Div + MACD Div).
1. Overview
| Property | Details |
|---|---|
| Indicator name | Divergences |
| Category | Momentum and volume |
| Type | Chart overlay (arrows and labels on the price chart) |
| Display | Green arrows (bullish) and red arrows (bearish) with a label such as RSI Div, MACD Div or CVD Div |
| Data | Price candles plus RSI, MFI, MACD, volume, CVD and OBV data |
| Availability | Advanced indicator, off by default |
A divergence appears when price and an indicator tell different stories. For example, price makes a new low while an indicator makes a higher low. This often means that the move is losing strength. The Divergences indicator finds these situations for seven indicators and marks them on the chart.
2. Purpose of the indicator
What does it measure?
It compares price with RSI, MFI, MACD, Volume, CVI, CVD and OBV. When price and one of these disagree, an arrow with the name of the indicator is placed on the candle. If more than one indicator shows a divergence on the same candle, the labels are combined, for example MFI Div + MACD Div.
When do you use it?
- To spot weakening momentum before a reversal.
- To find possible turning points at highs and lows.
- To see when several indicators agree, which makes a signal stronger.
- To get an extra reason to wait or to be careful during a strong trend.
3. How to read the indicator
- Green arrow below a candle: a bullish divergence. Price made a low that the indicator did not confirm, so selling pressure may be fading.
- Red arrow above a candle: a bearish divergence. Price made a high that the indicator did not confirm, so buying pressure may be fading.
- Label: the text next to the arrow tells which indicator shows the divergence, for example CVD Div or MACD Div.
- Combined labels: MFI Div + MACD Div means two indicators show a divergence on the same candle, as in the screenshot in September.
- Not a timing tool: a divergence can stay for a while before price reacts. Wait for a confirming candle.
- Different sources: RSI, MFI and MACD look at momentum, Volume, CVD and OBV look at volume flow.
4. Settings
| Setting | Default | Description |
|---|---|---|
| Divergences | Off | Show or hide the divergence arrows on the price chart. |
| RSI Divergence | On | Show or hide divergences for RSI. |
| MFI Divergence | On | Show or hide divergences for MFI. |
| MACD Divergence | On | Show or hide divergences for MACD. |
| Volume Divergence | On | Show or hide divergences for Volume. |
| CVI Divergence | On | Show or hide divergences for CVI. |
| CVD Divergence | On | Show or hide divergences for CVD. |
| OBV Divergence | On | Show or hide divergences for OBV. |
5. Tips and combinations
- Start with all seven switched on, then hide the ones that give too many signals for the coin you trade.
- Divergences on the 4h and 1d timeframes are more reliable than on low timeframes.
- A divergence on several indicators at once, such as MFI Div + MACD Div, usually deserves more attention.
- In a strong trend a divergence can appear many times before price turns. Do not trade it alone.
- Combine with Candlestick Patterns, the SMC indicator and the SuperTrend indicator to find a confirmation at an important level.
6. Disclaimer
This indicator and its data are for information only and are not financial advice.
Watch the Crypto Cockpit intro video:
Watch all our videos via this link:
https://aitraderview.com/youtube-videos/
⚠️ RISK WARNING & AI DISCLOSURE
- This information is generated by Artificial Intelligence (AI) and complex algorithms. While advanced, these systems can contain errors or inaccuracies and are for educational purposes only.
- Technical analysis provides no guarantees; this information is purely informative.
- All discussed scenarios are hypothetical and do not constitute predictions or expectations.
- Past performance is not an indicator of future results.
- This is not financial advice and is not intended as a call-to-action for the reader.
- No implicit direction is claimed, and no specific behavior of market participants is suggested.