
#2 Crypto Cockpit: The Chart & Drawing Tools
#2 Crypto Cockpit: The Chart & Drawing Tools
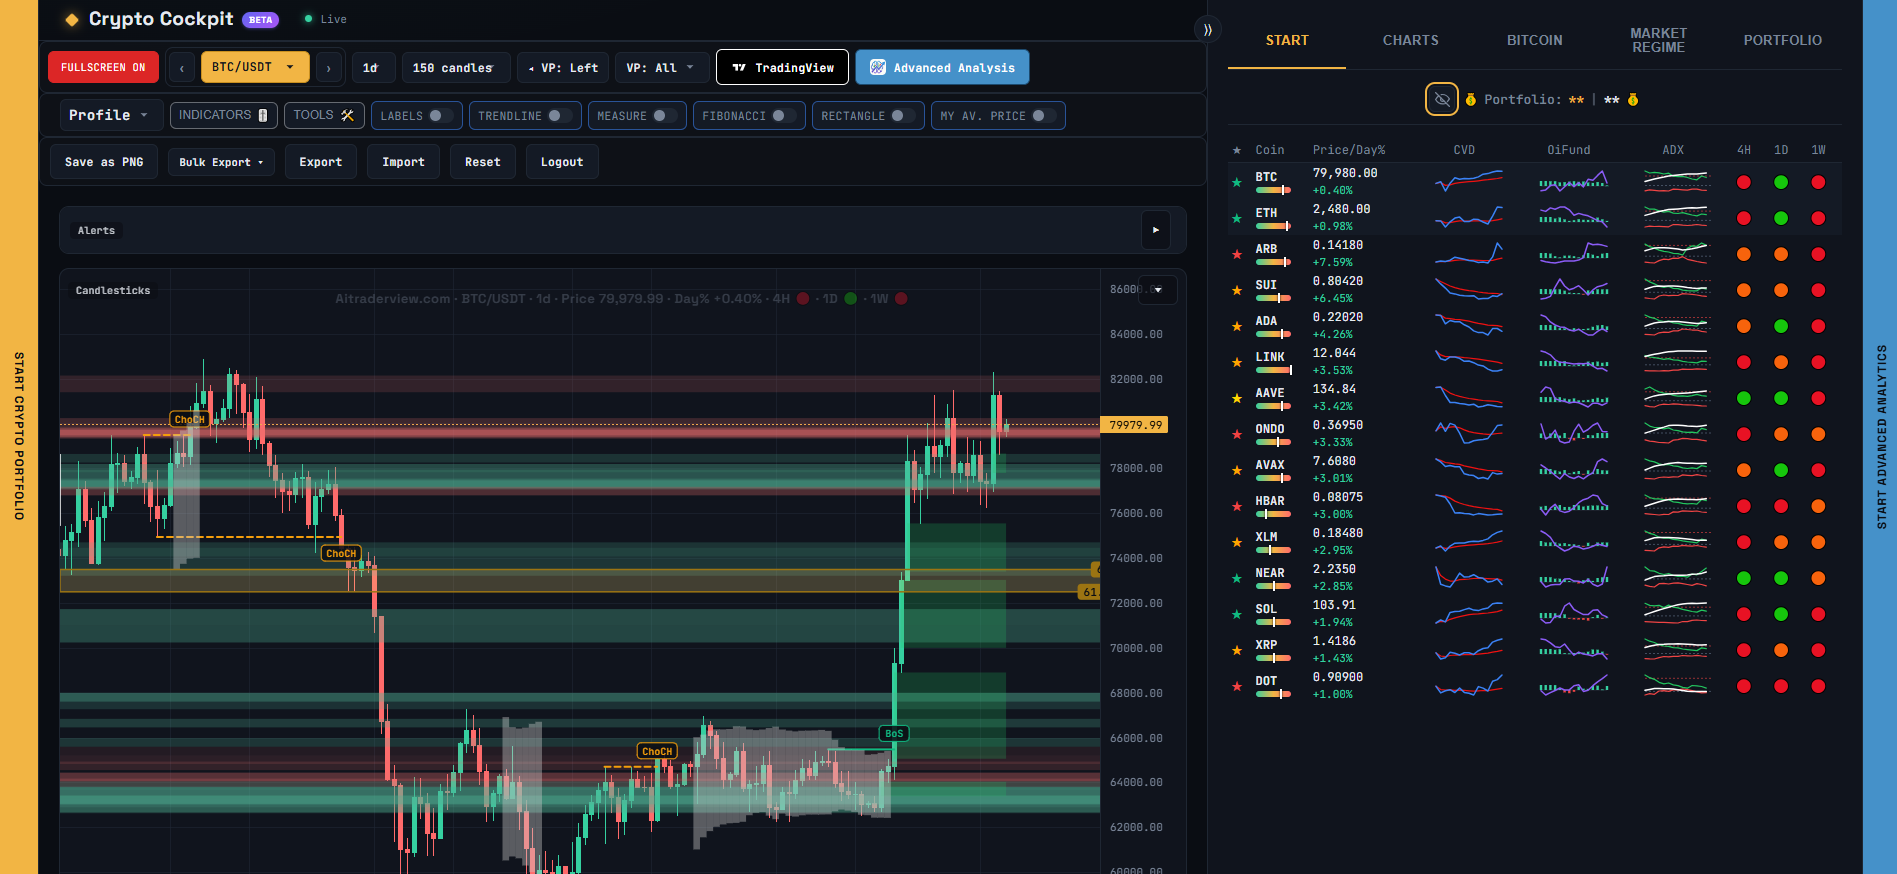
This article covers everything in the toolbar above the chart: viewing options and the hands-on drawing tools.
[SCREENSHOT: The toolbar with Fullscreen, Indicators, Tools, and the switch row]
## Fullscreen
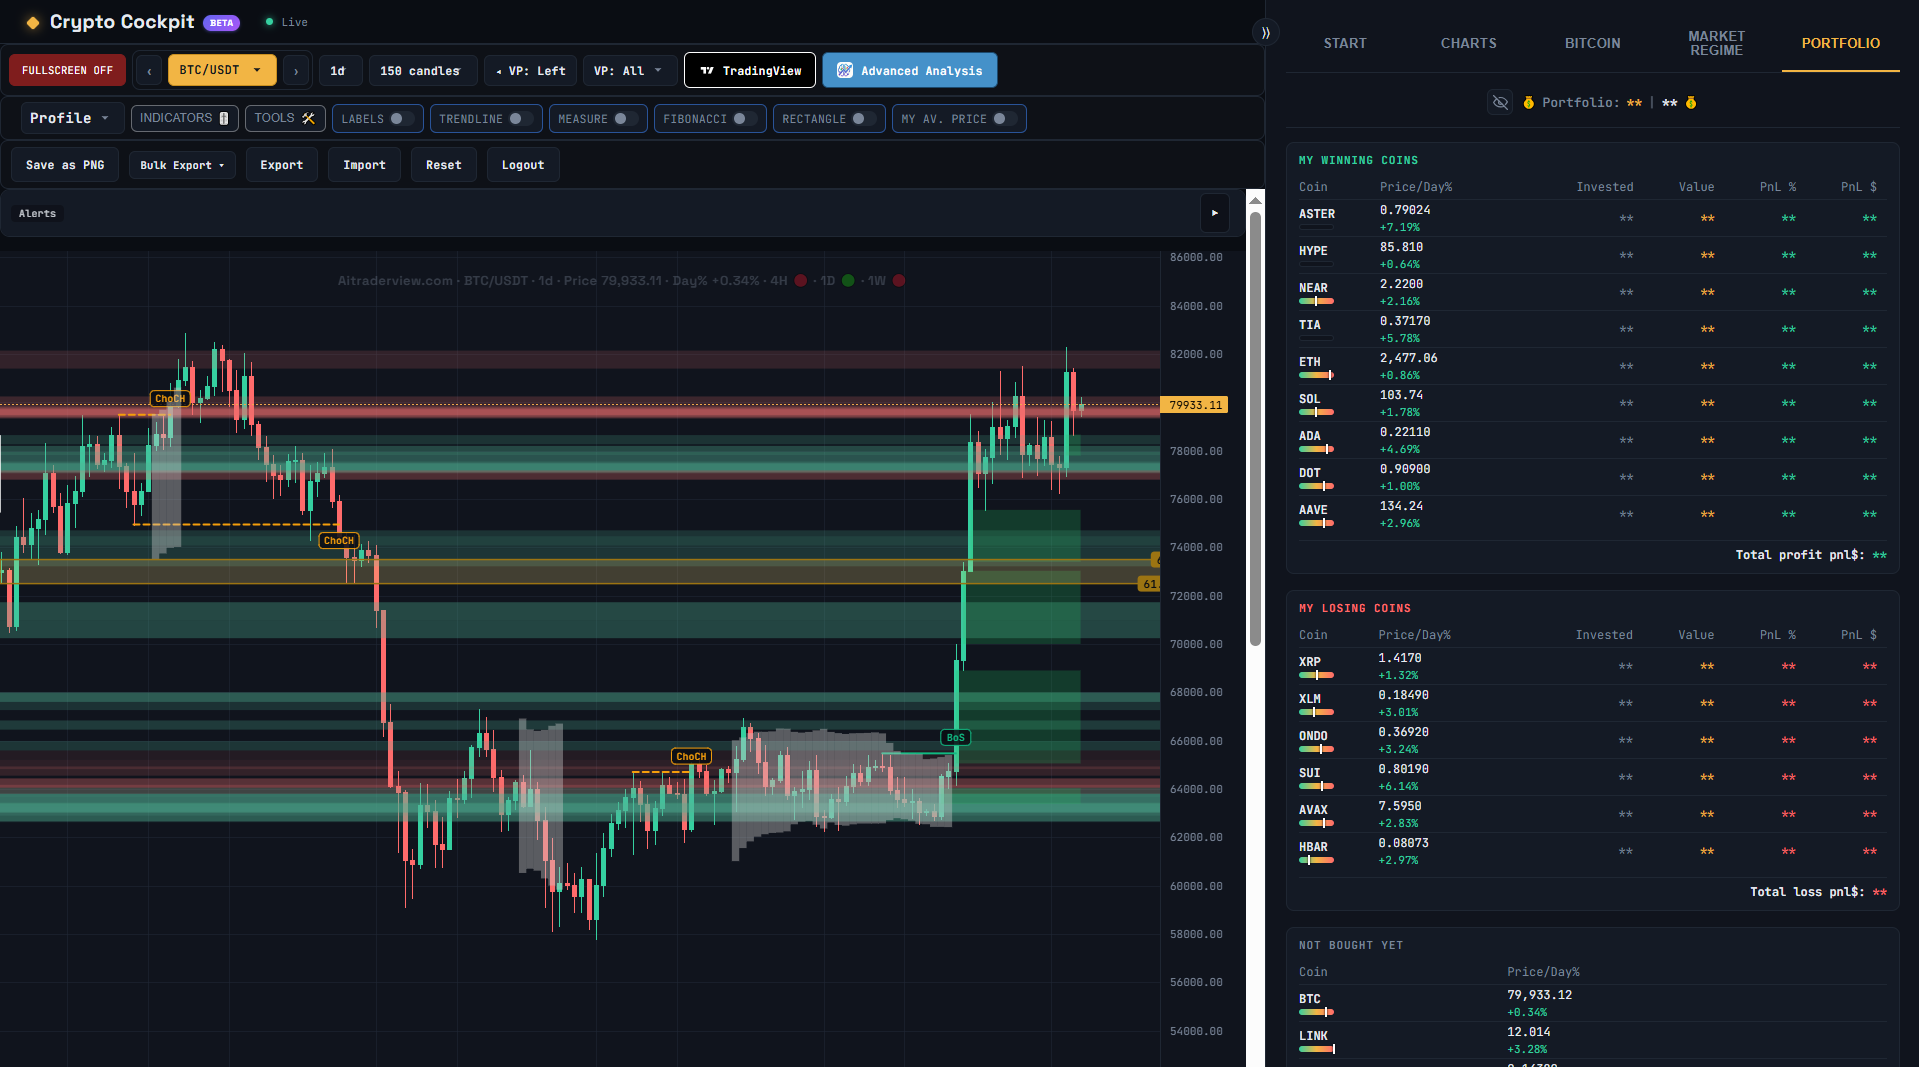
Click **Fullscreen** to expand the chart to fill your screen — useful when you want to focus purely on price action. Click again (or use the on-screen control) to exit.
[SCREENSHOT: The chart in fullscreen mode]
## Collapsing the chart panel
The candlestick chart has its own header (“Candlesticks”) with a collapse arrow, just like the Alerts bar. Click it to collapse the chart panel out of the way — for example if you only want to look at the Alerts bar or the panel indicators below it — and click again to bring it back.
## Tools menu
Click **Tools** to reveal the drawing-tool switches: Labels, Trendline, Measure, Fibonacci, Rectangle, and My Av. Price. Each one is a simple on/off switch.
### Labels
Toggles whether text labels (coin name, level labels, etc.) are shown on the chart.
### Trendline
Turn it on, then drag on the chart to draw a trendline. Right-click a line to remove it. Turn the switch off when you’re done drawing so you don’t accidentally start new lines while working with the chart.
### Measure
Turn it on, then drag from one point to another on the chart to see the percentage change between them — handy for quickly checking the size of a move.
### Fibonacci
Turn it on, then drag between a swing high and a swing low to draw Fibonacci retracement levels. Right-click a level to remove it.
### Rectangle
Turn it on, then drag to draw a rectangular zone on the chart — useful for marking a range or area of interest. Right-click a rectangle to remove it.
### My Av. Price
Shows your average buy price for the selected coin (pulled from Crypto Portfolio) as a horizontal line directly on the chart, so you can see at a glance where the current price sits relative to your position.
## Resizing the Levels panel
Click the **⟩⟩ / ⟩ / ⟨⟨** button in the top corner of the Levels panel to cycle its width between Full, Half, and Collapsed — useful when you want more room for the chart itself.
## A note on the drawing tools
Trendlines, measurements, Fibonacci levels, and rectangles are visual aids you draw yourself. They reflect your own reading of the chart — the app does not draw them for you or suggest where to place them, and none of them are a signal to buy or sell.
⚠️ RISK WARNING & AI DISCLOSURE
- This information is generated by Artificial Intelligence (AI) and complex algorithms. While advanced, these systems can contain errors or inaccuracies and are for educational purposes only.
- Technical analysis provides no guarantees; this information is purely informative.
- All discussed scenarios are hypothetical and do not constitute predictions or expectations.
- Past performance is not an indicator of future results.
- This is not financial advice and is not intended as a call-to-action for the reader.
- No implicit direction is claimed, and no specific behavior of market participants is suggested.