
#4 Crypto Cockpit: Panel Indicators & Indicator Profiles
Some indicators don’t overlay on the candlesticks — they get their own panel below the chart. This article covers those panel indicators, and how to save your favorite indicator setups as a reusable profile.
## Panel indicators
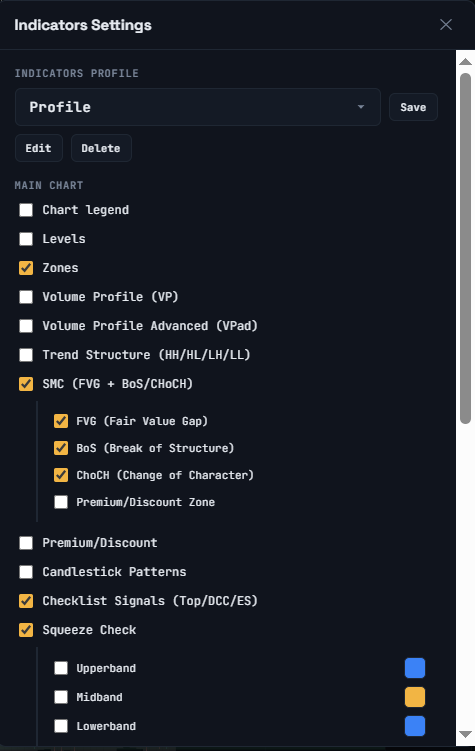
In the **Indicators Settings** window, scroll to **Panel indicators**. Each one can be turned on/off and assigned to one of 30 panel slots, and dragged to reorder them.
[SCREENSHOT: The Panel indicators list in the Indicators Settings window]
Available panels:
– **PowerTrades** / **Global PowerTrades** — a histogram showing whether buy volume or sell volume dominates (per-coin and market-wide)
– **Whales Buy/Sell ratio** — the ratio of large (“whale”) buy volume to sell volume; a ratio at or above 1 leans bullish, below 1 leans bearish
– **Momentum, CVD & price** — net volume, Cumulative Volume Delta (CVD) and its moving average, plotted alongside price
– **Open interest, funding & price** — funding rate and open interest (with a moving average), plotted alongside price
– **Top Long & Shorts (account ratio)** — the long % vs. short % among top trader accounts
– **Trading Activity (count buys & sells)** — a count of buy and sell trades over time
– **EMA & Mean reversion** — flags when price is “stretched” away from its EMAs, in either direction
– **RSI/Stoch & Mean reversion** — a table-style view combining RSI/Stochastic readings with mean-reversion context
– **RSI (14)** — the 14-period Relative Strength Index, with its own SMA line and color
– **ADX (14)** — the 14-period Average Directional Index (trend strength), with +DI/−DI lines
– **Squeeze Momentum** — a separate panel version of the squeeze indicator
– **Relative Volume** — current volume compared to typical volume for that time of day
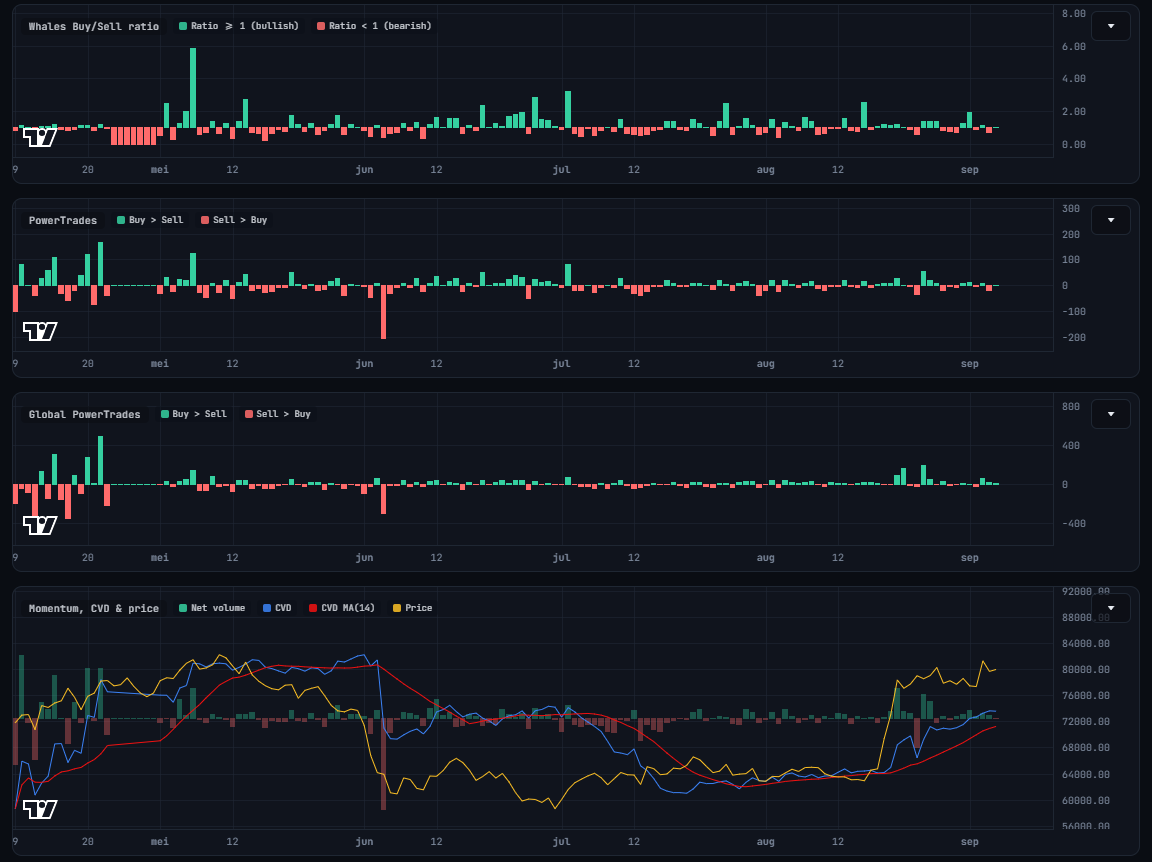
Each panel indicator’s legend explains what its colors mean — for example, PowerTrades shows green when buy volume exceeds sell volume and red for the reverse.
## Saving indicator profiles
Once you’ve set up indicators the way you like them, you can save that whole setup as a named profile:
1. Open **Indicators Settings**.
2. Under **Indicators Profile**, click **Save**, and give your setup a name.
3. Your profile now appears in the profile dropdown (both in the settings window and as a quick-switch dropdown in the toolbar), so you can jump between different setups instantly.
[SCREENSHOT: The Indicators Profile row with the dropdown and Save/Edit/Delete buttons]
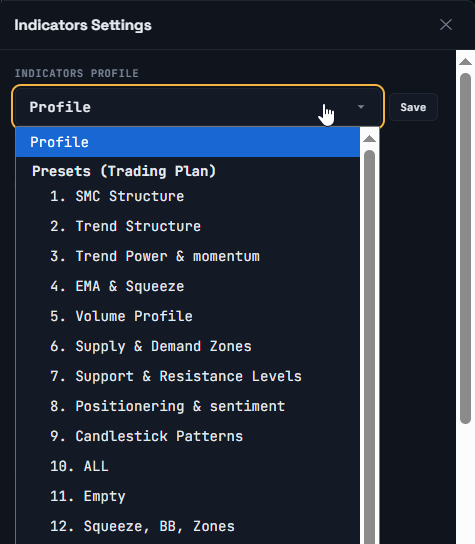
You can **Edit** (rename) or **Delete** any profile you’ve saved. The app’s built-in preset profiles can’t be renamed, overwritten, or deleted — if you want to start from one, save it under a new name first and customize the copy.
## A note on panel indicators
These panels show calculated market data (volume, funding, open interest, positioning ratios, and so on) to help you build your own picture of what’s happening. They describe current and past conditions — they don’t predict future price movement and aren’t a recommendation to trade.
⚠️ RISK WARNING & AI DISCLOSURE
- This information is generated by Artificial Intelligence (AI) and complex algorithms. While advanced, these systems can contain errors or inaccuracies and are for educational purposes only.
- Technical analysis provides no guarantees; this information is purely informative.
- All discussed scenarios are hypothetical and do not constitute predictions or expectations.
- Past performance is not an indicator of future results.
- This is not financial advice and is not intended as a call-to-action for the reader.
- No implicit direction is claimed, and no specific behavior of market participants is suggested.