
#3 Crypto Cockpit: Indicators (Main Chart)
#3 Crypto Cockpit: Indicators (Main Chart)
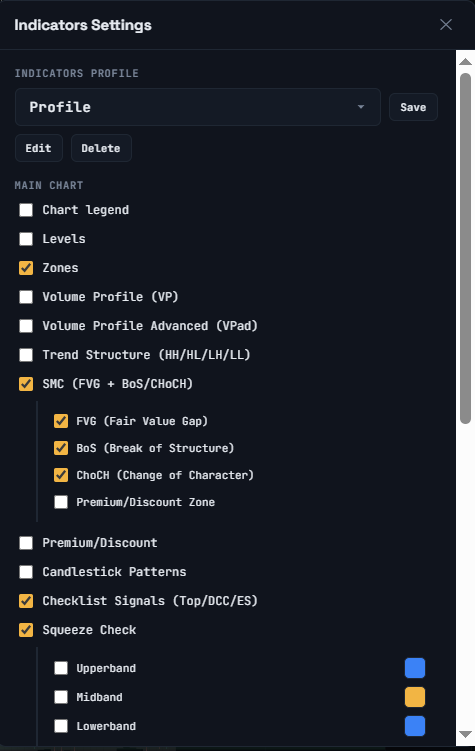
Click the **Indicators** button in the toolbar to open the Indicators Settings window. The **Main chart** section controls everything that can be drawn directly on top of your candlesticks.
[SCREENSHOT: The Indicators Settings window, Main chart section]
## Overlays
– **Chart legend** — shows a legend describing the active indicators
– **Levels** — shows your pinned/API price levels on the chart (see **”Levels: Pinned, API & Social Levels”**). A dropdown here also lets you show another trader’s shared levels directly on the chart
– **Zones** — highlights zone-based areas on the chart
– **Volume Profile (VP)** and **Volume Profile Advanced (VPad)** — shows how much trading volume occurred at each price level over the selected window. Use the **VP: Left/Right** button in the chart controls to move the profile to either side of the chart, and the **VP window** dropdown to choose the time window it’s calculated over — a fixed cycle, 1D up to 1095D, “All”, or **Regime**
– **Trend Structure (HH/HL/LH/LL)** — marks higher highs, higher lows, lower highs, and lower lows to visualize the current swing structure
– **SMC (FVG + BoS/CHoCH)** — Smart Money Concepts markers, with each element toggled individually: **FVG** (Fair Value Gap), **BoS** (Break of Structure), **ChoCH** (Change of Character), and the **Premium/Discount Zone** overlay
– **Premium/Discount** — marks whether price is currently trading in the upper (“premium”) or lower (“discount”) part of a recent range
– **Candlestick Patterns** — highlights recognized candlestick patterns on the chart; use “Select all” to enable every pattern at once, or pick individual ones
– **Checklist Signals (Top/DCC/ES)** — marks the app’s automated checklist signals directly on the chart
– **Squeeze Check** — shows the Upper/Mid/Lower squeeze bands; each band has its own on/off checkbox and its own color picker, so you can show just the bands you care about
– **Orderbook Heatmap** — visualizes order book depth as a heatmap, with an optional **Peak filter** to only highlight the strongest levels
## Moving averages and VWAP
– **EMA Trend (8/20/50/200)** and **SMA Trend (8/20/50/200)** — exponential and simple moving averages at four common lengths. Each line has its own on/off checkbox, color picker, and line-width field.
– **Session VWAP (Daily / Weekly / Monthly)** — volume-weighted average price, calculated per session and reset daily, weekly, or monthly (UTC), each with its own on/off checkbox, color, and line width.
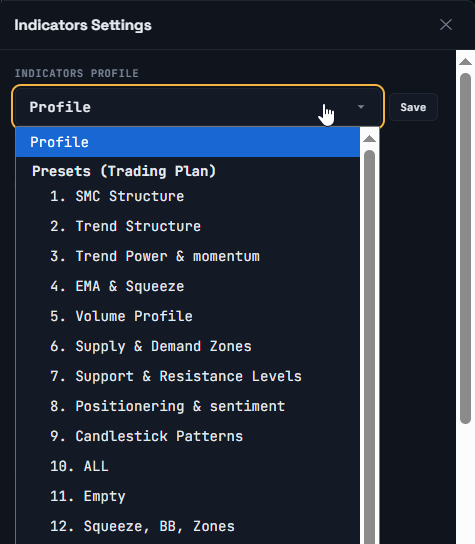
## The per-coin Regime badge
When the **VP window** dropdown is set to **Regime**, a small badge appears above the chart (and in the Charts tab) showing that coin’s own bullish/neutral/bearish read, a confidence percentage, and how long that read has held — separate from the market-wide **Market Regime** tab covered later in this series.
## A note on reading these indicators
These are standard technical-analysis tools that describe past and current price behavior. They do not predict future price movement, and using them does not guarantee a particular outcome. How you interpret and act on them is entirely up to you.
⚠️ RISK WARNING & AI DISCLOSURE
- This information is generated by Artificial Intelligence (AI) and complex algorithms. While advanced, these systems can contain errors or inaccuracies and are for educational purposes only.
- Technical analysis provides no guarantees; this information is purely informative.
- All discussed scenarios are hypothetical and do not constitute predictions or expectations.
- Past performance is not an indicator of future results.
- This is not financial advice and is not intended as a call-to-action for the reader.
- No implicit direction is claimed, and no specific behavior of market participants is suggested.