
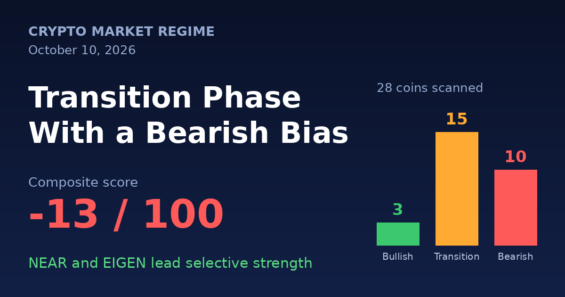
The AiTraderView Market Regime scan for October 10, 2026 classifies the crypto market as Transition / Early Recovery, with a composite score of -13 out of 100. Pockets of recovery are visible, but negative altcoin breadth and weak higher-timeframe orderflow do not confirm a broad bull market.
Altcoin weakness is the main drag: TOTAL1 is down 2.46%, TOTAL2 down 6.18% and TOTAL3 down 8.54%, while BTC dominance is rising. Of the 28 coins scanned, only 3 are bullish, 15 sit in the transition zone and 10 are bearish.
Regime distribution (28 coins)
| Regime | Coins | Share |
|---|---|---|
| 🟢 Bullish | 3 | 11% |
| 🟠 Transition / recovery | 15 | 54% |
| 🔴 Bearish | 10 | 36% |
Final ranking
| Category | Coins | Key observation |
|---|---|---|
| Strong | NEAR, EIGEN | Positive daily and weekly structures; best multi-timeframe alignment |
| Bullish, with clear risks | RENDER, SOL, ALGO, XLM, HYPE, TIA, ADA, AVAX, LINK, ARB | Some bullish structure, but timeframe or CVD conflicts remain |
| Reversal / recovery candidates | UNI, SEI, DOT, CRV, PUMP | Recovery signals present but incomplete |
| Bearish | BTC, ETH, XRP, AAVE, SUI, DOGE, ONDO, HBAR, ASTER, PAXG, ZRO | Persistent higher-timeframe weakness or conflicting structure |
Strongest and weakest coins
| Coin | Regime | Score | Short reason |
|---|---|---|---|
| NEAR | 🟢 | +54 | Daily and weekly uptrends; daily CVD rising |
| EIGEN | 🟢 | +54 | Daily and weekly uptrends; daily CVD rising |
| RENDER | 🟢 | +30 | Daily and weekly uptrends; CVD remains weak |
| SOL | 🟠 | +26 | Daily and weekly CVD rising; structure mixed |
| ALGO | 🟠 | +26 | Rising daily/weekly CVD; weekly structure bearish |
| BTC | 🟠 | -12 | 4H/weekly downtrend; short-term absorption is supportive |
| ONDO | 🔴 | -24 | Weak 4H structure; negative CVD across timeframes |
| AAVE, SUI, DOGE, ETH, ZRO | 🔴 | -54 | Downtrends and/or persistently negative CVD |
Scores are relative, model-derived assessments, not exchange-issued signals.
Bitcoin: range with downside risk
BTC trades at about $83,049 (+0.50%). The 4H chart shows bullish absorption (4H CVD +$64.4M), but daily CVD is -$769.9M and the weekly trend is down. A whale-buying burst at 07:00 (81 whale buys vs 6 sells, volume delta +$46.4M) was the strongest positive anomaly, yet later negative hourly deltas mean sustained accumulation is not confirmed.
| 72H scenario | Probability | Expected zone |
|---|---|---|
| 🟢 Bull | 25% | $83,490 – $85,405 |
| 🟠 Range | 45% | $81,575 – $84,467 |
| 🔴 Bear | 30% | $79,659 – $81,575 |
| Key BTC level | Price |
|---|---|
| Major resistance | $85,405.58 |
| Bull confirmation | $84,466.63 |
| Immediate resistance | $83,490.04 |
| Immediate support | $81,574.50 |
| Bear confirmation | $80,635.55 |
| Major support | $79,658.96 |
BTC is most likely to range, with downside risk, until it reclaims $83,490–$84,467 (confidence 61/100). The market remains a selective, flow-driven environment rather than a confirmed bull trend. Scenario probabilities are model estimates, not MCP-reported values.
Sources:
⚠️ RISK WARNING & AI DISCLOSURE
- This information is generated by Artificial Intelligence (AI) and complex algorithms. While advanced, these systems can contain errors or inaccuracies and are for educational purposes only.
- Technical analysis provides no guarantees; this information is purely informative.
- All discussed scenarios are hypothetical and do not constitute predictions or expectations.
- Past performance is not an indicator of future results.
- This is not financial advice and is not intended as a call-to-action for the reader.
- No implicit direction is claimed, and no specific behavior of market participants is suggested.