
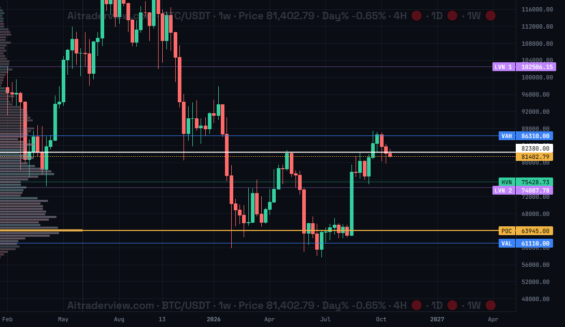
Bitcoin is struggling to break resistance around $86,000, and according to analysts in the crypto community, a rally to $98,000 before the US midterm elections looks increasingly unlikely. The level matters because it matches the midpoint of the summer lows and the 2025 yearly lows. The widely expected “Uptober” rally has so far failed to appear.
Analysts point to earlier cycles, when Bitcoin fell sharply after the midterms: roughly 52% in 2018 and about 27% in 2022. For 2026 they expect a milder correction of 16% to 20%. From $86,000, that would take BTC to roughly $69,000 to $72,000. This is a scenario rather than a forecast, and past patterns offer no guarantee.
They do not see a post-election dip as the start of a long bear market, but as a possible chance to buy at lower prices. An alternative view is that the earlier low near $58,000 may already have been the cycle bottom, in which case the post-midterm path could differ from previous years.
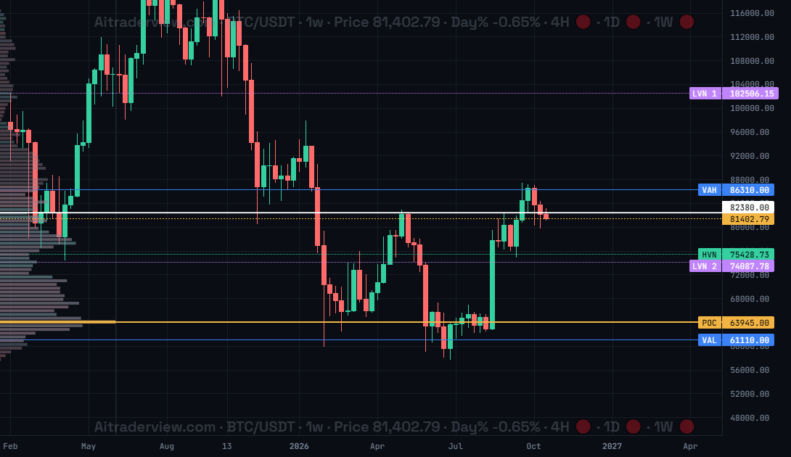
On the weekly chart, BTC trades near $81,400, below the value area high at $86,310. If a correction does unfold, the high-volume node near $75,400, the point of control at $63,945 and the value area low at $61,110 are the levels to watch. The key question is whether buyers can push through $86,000 or whether a new pullback follows.
Track the market yourself with AiTraderView’s free tools: Crypto Cockpit for charts and 75+ indicators, Crypto Screener to find setups, and Crypto Portfolio to follow your holdings.
⚠️ RISK WARNING & AI DISCLOSURE
- This information is generated by Artificial Intelligence (AI) and complex algorithms. While advanced, these systems can contain errors or inaccuracies and are for educational purposes only.
- Technical analysis provides no guarantees; this information is purely informative.
- All discussed scenarios are hypothetical and do not constitute predictions or expectations.
- Past performance is not an indicator of future results.
- This is not financial advice and is not intended as a call-to-action for the reader.
- No implicit direction is claimed, and no specific behavior of market participants is suggested.