
#7 Crypto Cockpit: CoinStats & Info Tab
#7 Crypto Cockpit: CoinStats & Info Tab
These two tabs give you a bird’s-eye view of all your coins (CoinStats) and a written summary of the one you’re currently viewing (Info). Both live inside the **Charts** main tab.
## CoinStats: your full coin table
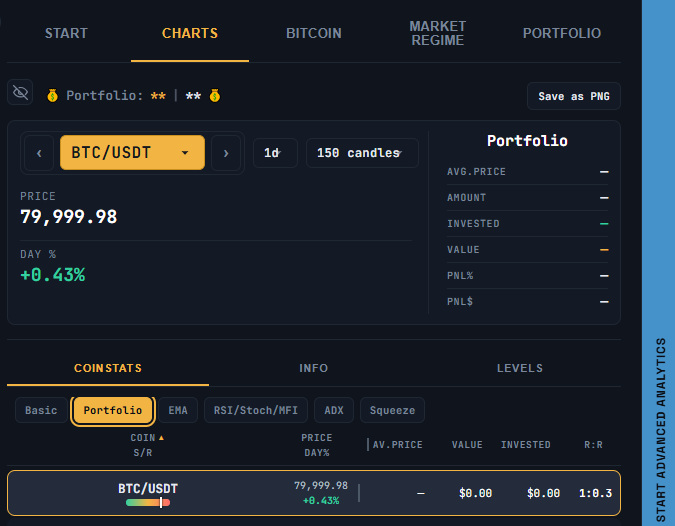
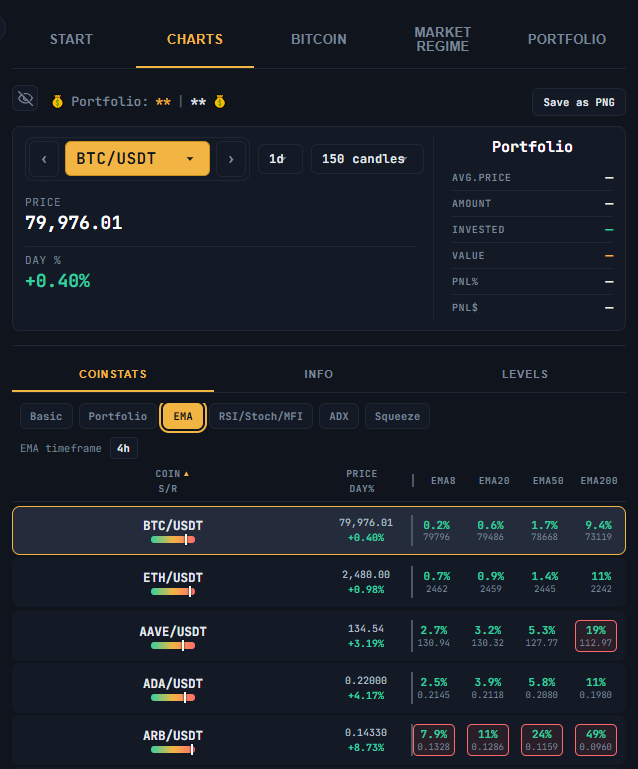
The **CoinStats** tab shows every coin you track in one sortable table, with several sub-tabs that add different columns:
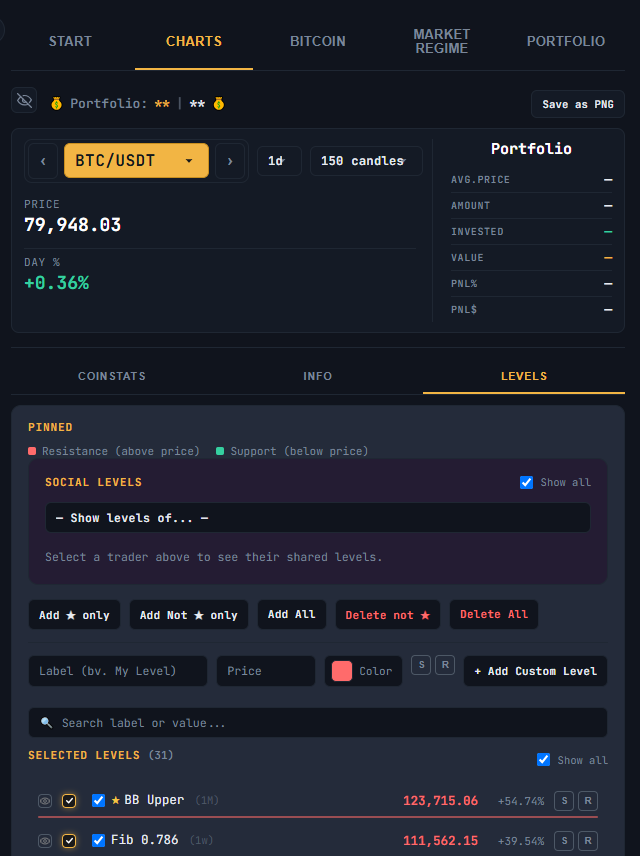
[SCREENSHOT: The CoinStats tab with the sub-tab row: Basic / Portfolio / EMA / RSI/Stoch/MFI / ADX / Squeeze]
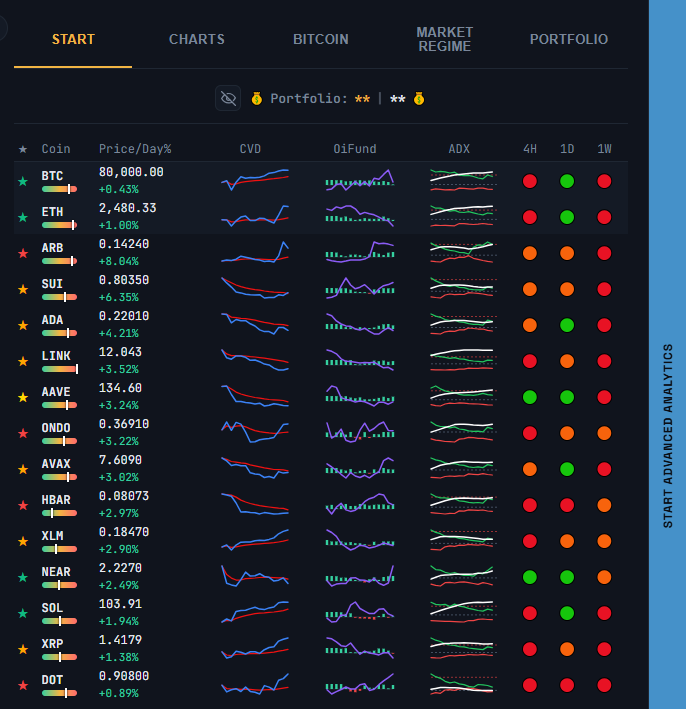
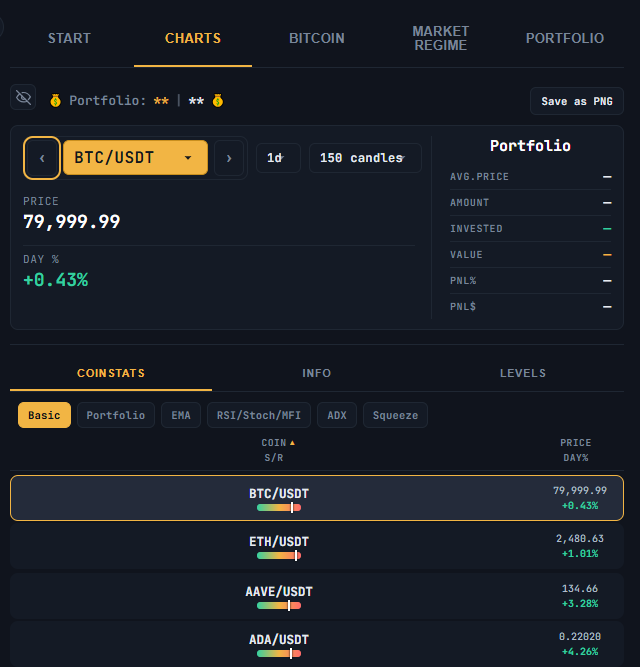
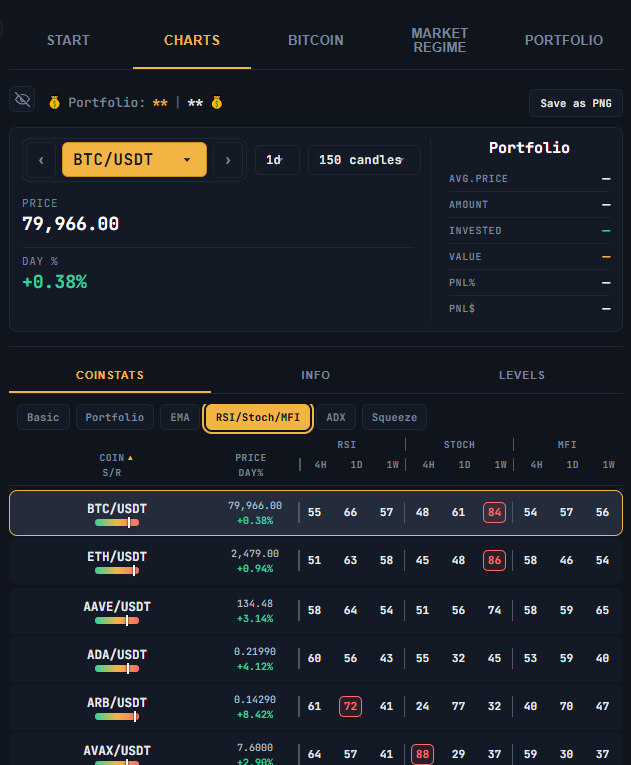
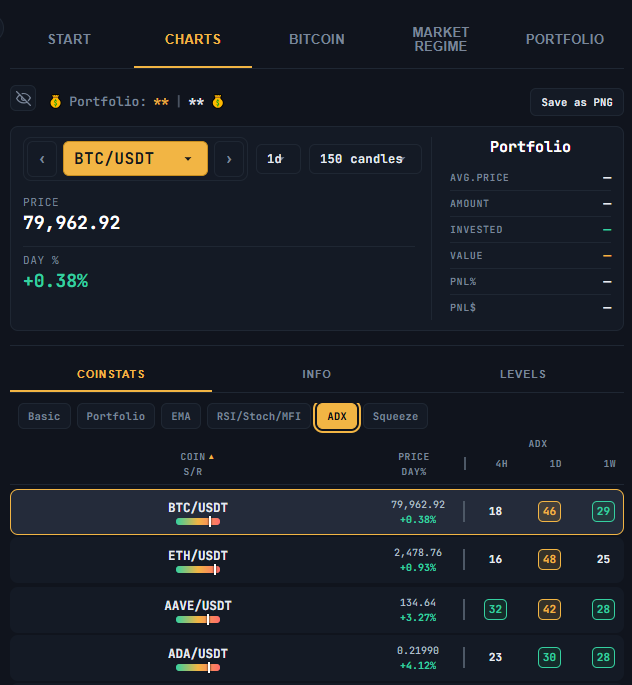
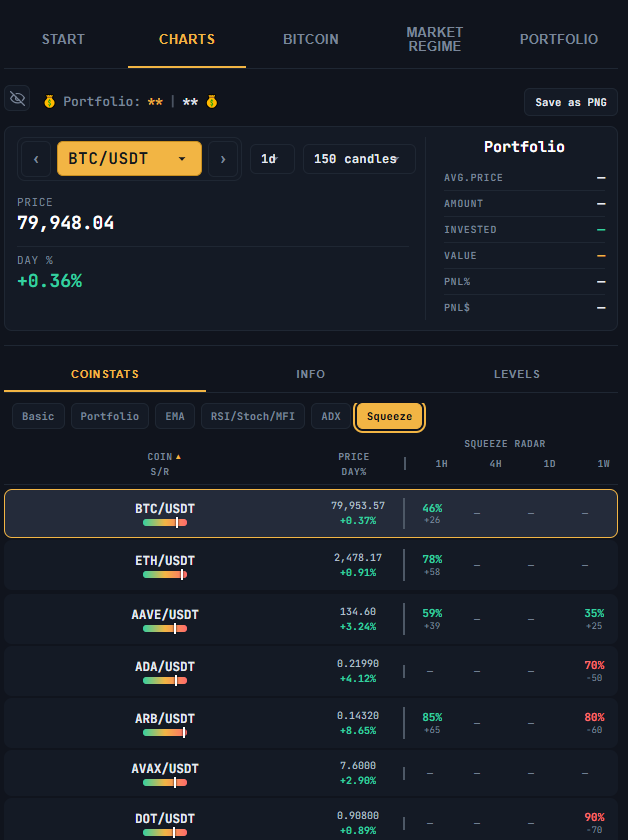
– **Basic** — Coin, S/R (position between support and resistance), Price, and Day %
– **Portfolio** — adds your average buy price, current value, invested amount, and risk/reward ratio (pulled from Crypto Portfolio)
– **EMA** — shows how far price sits from its EMA8/20/50/200, with a chosen timeframe (4h/1d/1w). A distance beyond a set threshold (for example, more than 4% from EMA8/20, more than 7% from EMA50, more than 12% from EMA200) is treated as “stretched”
– **RSI/Stoch/MFI** — RSI, Stochastic, and Money Flow Index readings across 4h/1d/1w. General reference ranges: RSI/MFI below 20-30 is often considered oversold and above 70-80 overbought; Stochastic below 20 oversold and above 80 overbought
– **ADX** — trend strength across 4h/1d/1w (below 20 is typically read as “no trend,” above 25 “strong trend,” above 40 “very strong,” above 50 “extreme”)
– **Squeeze** — Squeeze Radar readings across 1h/4h/1d/1w
Click any column header to sort by that column. Click a coin’s row to jump straight to its chart.
## Info tab: written summary
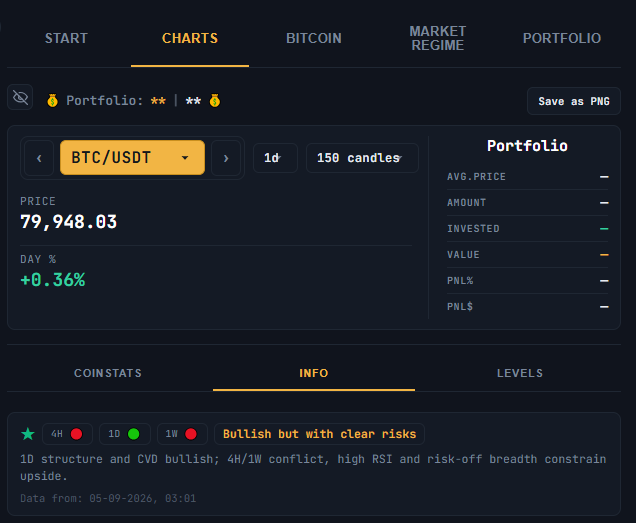
The **Info** tab shows a short written summary for the currently selected coin — its 4H/1D/1W trend, a classification, and a description, along with when this analysis was last generated.
## A note on these numbers
The oversold/overbought and trend-strength ranges mentioned above are commonly used technical-analysis conventions, not rules the market has to follow. All figures and written summaries here reflect an automated read of current and recent market data — they are informational only, are not personalized advice, and are not a guarantee of future price behavior.
⚠️ RISK WARNING & AI DISCLOSURE
- This information is generated by Artificial Intelligence (AI) and complex algorithms. While advanced, these systems can contain errors or inaccuracies and are for educational purposes only.
- Technical analysis provides no guarantees; this information is purely informative.
- All discussed scenarios are hypothetical and do not constitute predictions or expectations.
- Past performance is not an indicator of future results.
- This is not financial advice and is not intended as a call-to-action for the reader.
- No implicit direction is claimed, and no specific behavior of market participants is suggested.