
#1 Crypto Cockpit: Overview & Getting Started
1 Crypto Cockpit: Overview & Getting Started
Crypto Cockpit is a full charting workspace for the coins you follow. It combines a live candlestick chart, a large set of technical indicators, your own price levels, and several tabs of automated market analysis — all in one screen. It can also open Crypto Portfolio and Advanced Analytics in slide-out panels beside the chart, so you rarely need to leave the page.
[SCREENSHOT: Full Cockpit page, chart on the left, Levels panel on the right]]
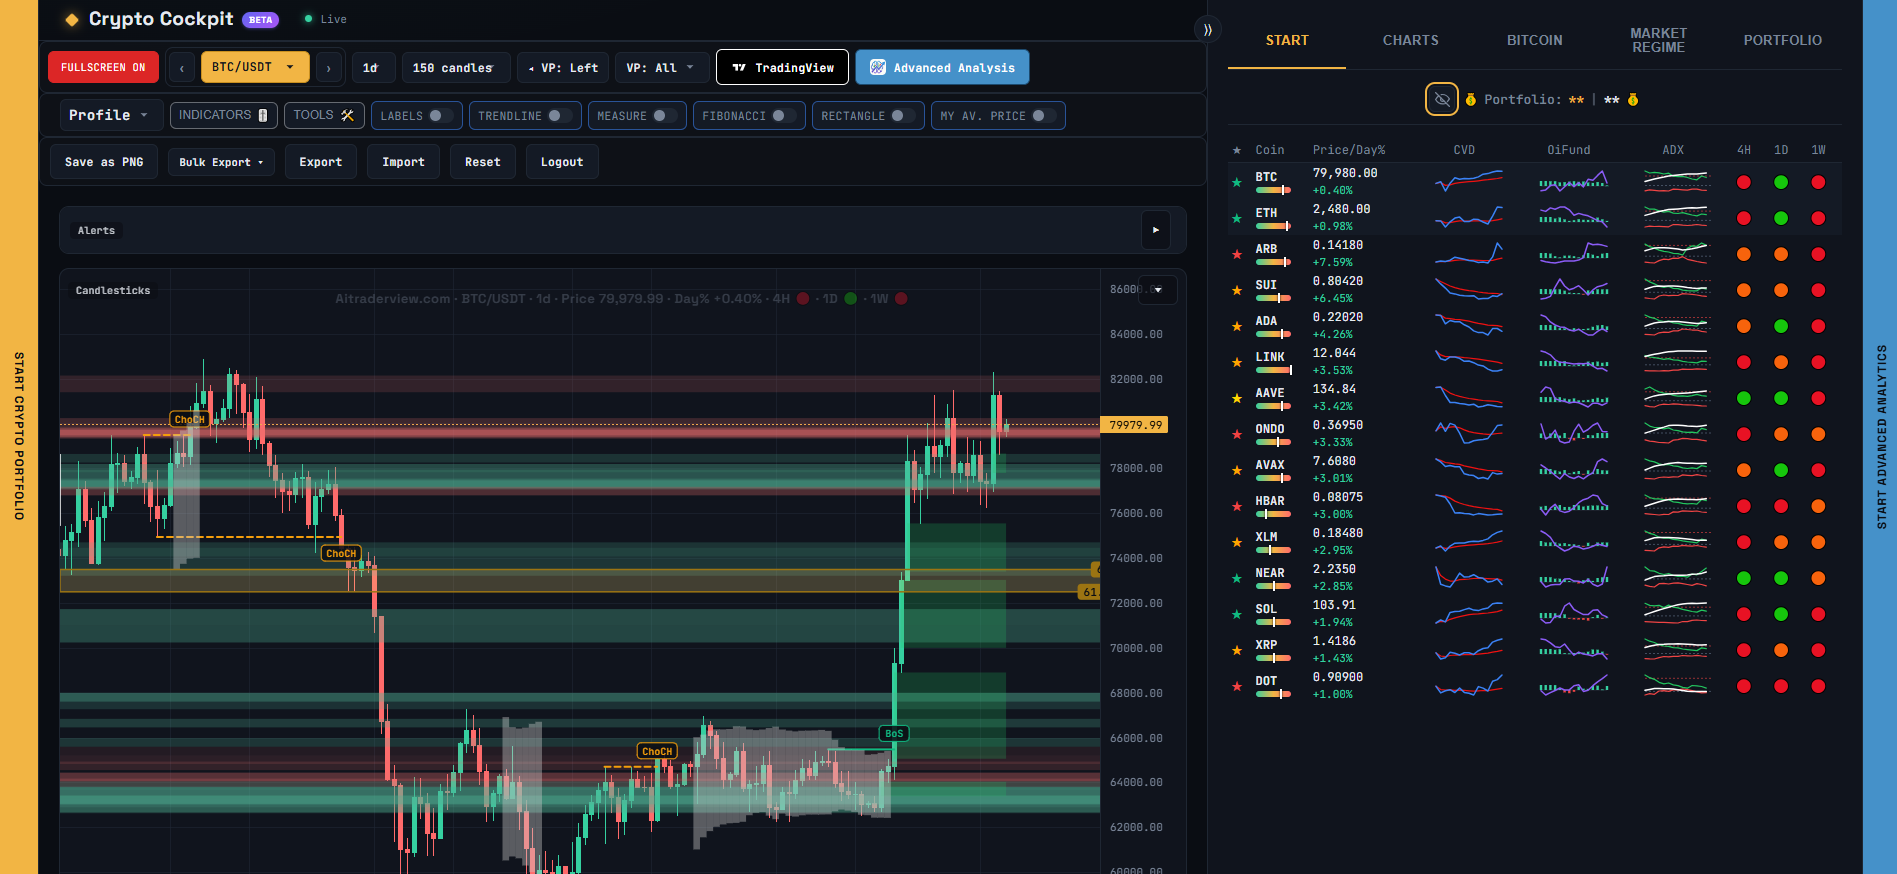
## The main layout
– **Top bar** — pick a coin, open TradingView or Advanced Analysis, save a chart image, bulk-export images, export/import your data, reset your settings, start a guided tour (❓ Help), and log out
– **Chart controls** — timeframe, number of candles, current price and day change, Volume Profile side/window settings
– **Toolbar** — Fullscreen, Indicators, Tools (drawing tools), and quick on/off switches for Labels, Trendline, Measure, Fibonacci, Rectangle, and “My Av. Price”
– **Chart** — the candlestick chart itself, with a collapsible Alerts bar above it and a collapse arrow on the chart panel itself
– **Levels panel** (right side, or below on mobile) — eight main tabs: **Start** (home icon), **Charts**, **Social Traders Hub**, **Bitcoin**, **Market Regime**, **Strength**, **Market Overview**, and **Portfolio** — plus, inside Charts, sub-tabs for Chart/CoinStats/Info/Levels/Import-Export. Every tab also shows your portfolio total and a fullscreen toggle at the top.
– **Side panels** — a resizable panel on the left that opens Crypto Portfolio, and one on the right that opens Advanced Analytics, both without leaving Cockpit (see the last article in this series)
## Picking a coin and timeframe
Use the coin dropdown (with the ‹ › arrows) at the top to switch coins, and the timeframe/candle-count dropdowns to change what the chart shows.
## What each tab does, at a glance
– **Start** (Levels panel) — a compact table of every coin you track, with your star category, price/day change, CVD, open interest/funding, ADX, and 4H/1D/1W trend, so you can scan the whole market at a glance. Your BTC and ETH rows are pinned to the top. Click a row to jump to that coin.
– **Charts** — your portfolio position for the selected coin, its trend/classification info, its price levels, and (when the Volume Profile window is set to “Regime”) a small per-coin market-regime badge
– **CoinStats** (inside Charts) — a sortable table of all your coins with price, EMA, RSI/Stoch/MFI, ADX, and Squeeze data
– **Info** (inside Charts) — a written summary for the selected coin
– **Levels** (inside Charts) — your pinned levels, API-suggested levels, custom levels, and levels shared by other traders (“Social Levels”)
– **Import & Export** (inside Charts, mobile only) — the same Save PNG / Bulk Export / Export / Import / Reset / Logout actions that sit in the top bar on desktop
– **Bitcoin** — automated Bitcoin-specific market intelligence
– **Market Regime** — an automated overall market read, a final ranking of coin categories, and a per-coin breakdown
– **Portfolio** — your winning coins, losing coins, and coins you haven’t bought yet
– **Social Traders Hub** — the same Pinned/API/Custom/Social Levels tools as the Levels sub-tab inside Charts, shown as its own full-width main tab
– **Strength** — a per-coin Buyer/Seller Strength score (-100 to +100) for the 1h/4h/1d timeframes, with a trade flow / orderbook / price response breakdown and a strength-over-time chart
– **Market Overview** — a macro dashboard: Dollar, Silver, stablecoin/BTC/ETH dominance, SPX, NDX, Gold, VIX, BTC, ETH, your own portfolio performance, and total crypto market cap (Total1/2/3), refreshed every minute
Each of these is covered in its own article — see the list at the end.
## Hiding your portfolio amounts
Click the eye icon next to any “Portfolio: …” total (top bar, mobile header, or any Levels-panel tab) to mask your portfolio values with placeholders — handy when sharing your screen. Click it again to reveal them. This applies everywhere the portfolio total or your positions are shown, and is remembered the next time you open Cockpit.
## Logging out
Click **Logout** in the top bar to sign out of your AiTraderView account from within Cockpit.
## A note before you dive in
Several parts of Cockpit — the Info tab, the Bitcoin tab, the Market Regime tab, the chart Alerts, the per-coin Regime badge, and the “star” categories — are generated automatically from the app’s technical analysis. They describe current market conditions as read by an automated system; they are not personalized advice, they can be wrong, and they are not a guarantee of what will happen next. Treat them as one input among many, not as instructions.
## Where to go next
– **The Chart & Drawing Tools** — fullscreen, labels, trendline, measure, Fibonacci, rectangle, “My Av. Price”, collapsing panels
– **Indicators (Main Chart)** — everything you can overlay directly on the candlesticks
– **Panel Indicators & Indicator Profiles** — the indicators shown in separate panels below the chart, and saving your own setups
– **Alerts** — the automated notification bar above the chart
– **Levels: Pinned, API & Social Levels** — managing your price levels and viewing other traders’ levels
– **CoinStats & Info Tab** — the sortable coin table and the written coin summary
– **Start, Portfolio, Bitcoin & Market Regime Tabs** — the market-overview and automated market-analysis tabs
– **Strength Tab** — the Buyer/Seller Strength score per coin
– **Market Overview Tab** — the macro/dominance/crypto dashboard
– **PNG Export, Import/Export & Reset** — saving chart images and backing up your settings
– **Advanced Analytics & Crypto Portfolio Side Panels** — opening the full app and your portfolio right beside the chart
– **Guided Tour & Help** — the interactive ❓ Help walkthrough
⚠️ RISK WARNING & AI DISCLOSURE
- This information is generated by Artificial Intelligence (AI) and complex algorithms. While advanced, these systems can contain errors or inaccuracies and are for educational purposes only.
- Technical analysis provides no guarantees; this information is purely informative.
- All discussed scenarios are hypothetical and do not constitute predictions or expectations.
- Past performance is not an indicator of future results.
- This is not financial advice and is not intended as a call-to-action for the reader.
- No implicit direction is claimed, and no specific behavior of market participants is suggested.