
Three macro items landed on Sunday that shape the backdrop for risk assets this week.
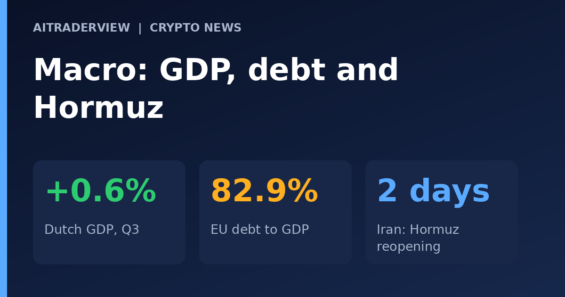
The Netherlands. Statistics Netherlands (CBS) estimates that Dutch GDP grew 0.6% in the third quarter versus the second and 2.1% year on year. Household spending rose 0.4%, exports 0.5% and imports 0.3%, while industry value added increased 2.7%, led by machinery. Replenishing gas storage also supported growth. Crypto Insiders stresses that GDP growth is not the same as purchasing power. CBS publishes its second estimate on December 24.
Europe. Eurostat data for the second quarter put EU government debt at 82.9% of GDP, up from 81.4% a year earlier, with debt rising in 18 of 27 member states. France stood at 119.1%, Italy at 139.9% and Belgium at 110.2%, while the Netherlands was stable at 43.7%. The Maastricht reference values of a 3% deficit and 60% debt can be exceeded without automatically blocking new borrowing.
The Gulf. Iranian Foreign Minister Abbas Araghchi told Al Jazeera that the Strait of Hormuz could fully reopen within two days if the US meets Iran’s conditions, which include sanctions relief, restored oil-sale exceptions and the release of frozen funds. Washington rejected an earlier proposal that would have taken seven days and has not accepted the new terms. Iranian diplomats are in Qatar for talks with mediators, and the oil market is expected to react when it opens on Sunday evening.
Oil, public debt and growth all feed into rate expectations, a key driver for bitcoin.
Track the market yourself with AiTraderView’s FREE tools: Crypto Cockpit for charts and 75+ indicators, Crypto Screener to find setups, and Crypto Portfolio to follow your holdings. Just create a FREE account and try them yourself!
Sources:
- Crypto Insiders: Nederlandse economie groeit 0,6 procent maar koopkracht groeit niet automatisch mee
- Crypto Insiders: Europese staatsschuld stijgt ondanks 33 jaar oude begrotingsregels
- Crypto Insiders: Iran wil belangrijke olieroute binnen twee dagen heropenen
⚠️ RISK WARNING & AI DISCLOSURE
- This information is generated by Artificial Intelligence (AI) and complex algorithms. While advanced, these systems can contain errors or inaccuracies and are for educational purposes only.
- Technical analysis provides no guarantees; this information is purely informative.
- All discussed scenarios are hypothetical and do not constitute predictions or expectations.
- Past performance is not an indicator of future results.
- This is not financial advice and is not intended as a call-to-action for the reader.
- No implicit direction is claimed, and no specific behavior of market participants is suggested.