
#5 Crypto Portfolio: ETF Flow Blocks
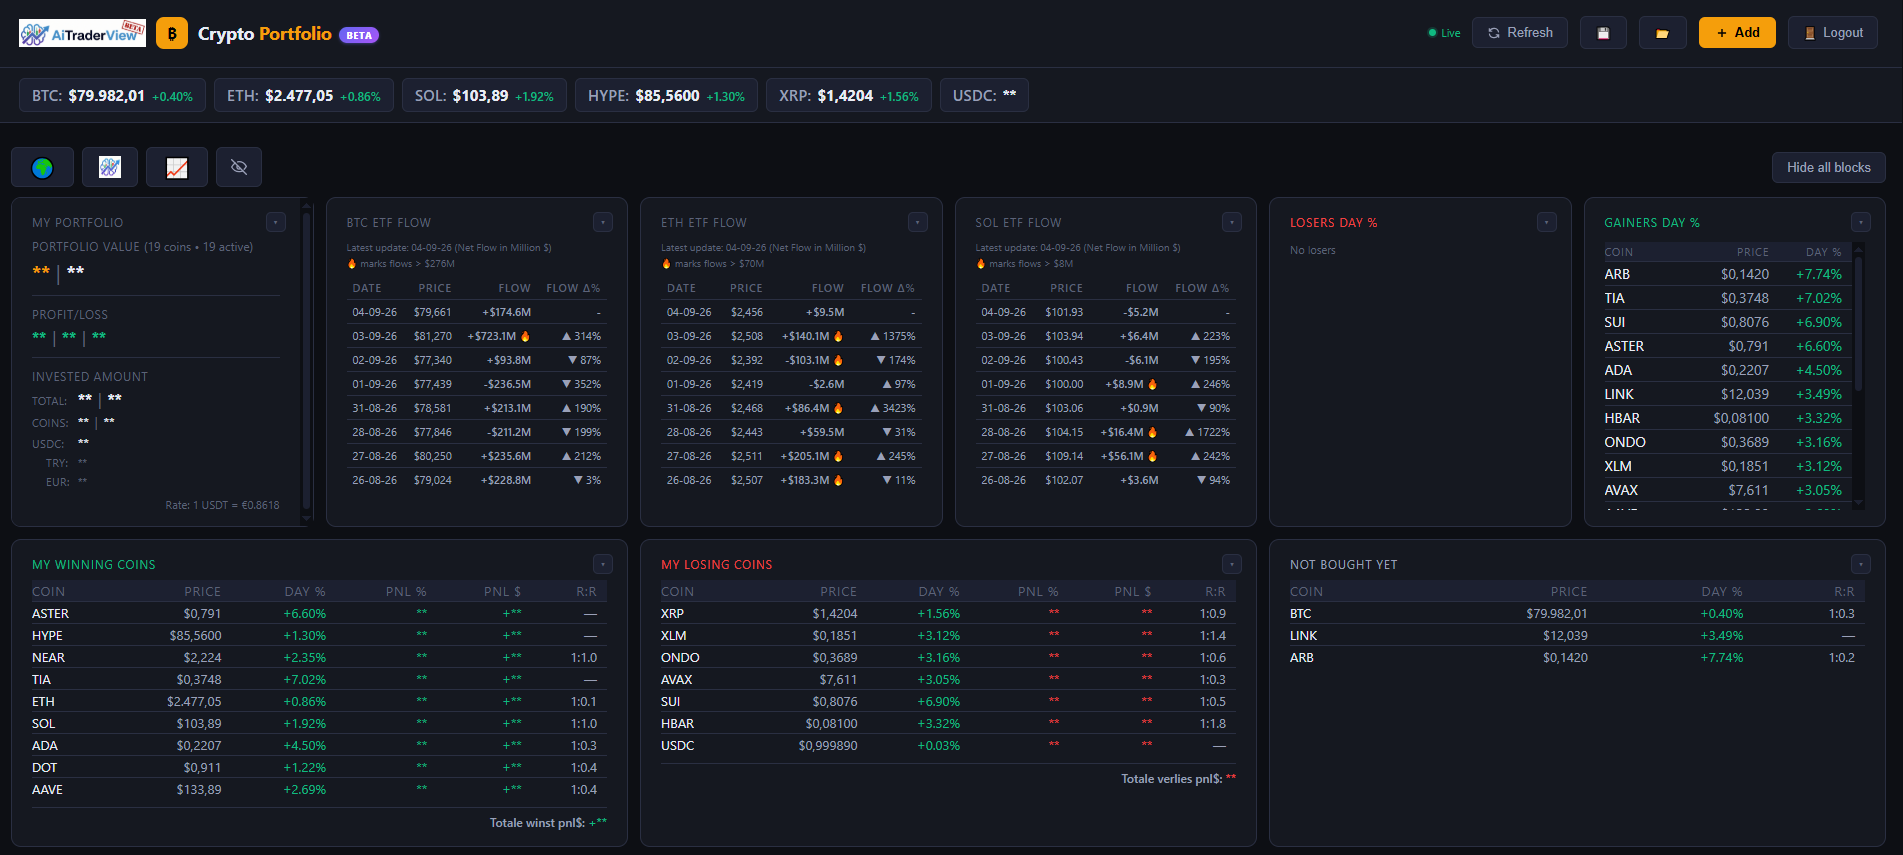
The BTC, ETH, and SOL ETF Flow blocks show daily net inflow or outflow for the major spot crypto ETFs — a widely watched indicator of institutional buying or selling interest.
[SCREENSHOT: The three ETF Flow blocks (BTC, ETH, SOL) side by side]
## Reading the table
Each block shows the last several trading days, with four columns:
– **Date** — the trading day the flow figure applies to
– **Price** — the asset’s price on that day
– **Flow** — the net flow in millions of dollars for that day. A positive number (green) means more money flowed into the ETFs than out; a negative number (red) means net outflow.
– **Flow Δ%** — how much the flow changed compared to the previous day
## The 🔥 marker
A day’s flow is marked with 🔥 when it crosses a notable threshold for that asset (for example, over $276M for BTC, $70M for ETH, or $8M for SOL). This is simply a visual flag to help a large flow day stand out — it does not indicate a buy or sell signal.
## What this data does and doesn’t tell you
ETF flow data reflects money moving in and out of ETF products, which can be one input among many when trying to understand market sentiment. It does not directly predict future price movement, and past flow patterns are not a guarantee of what will happen next. This block is provided for informational purposes only and is not investment advice.
⚠️ RISK WARNING & AI DISCLOSURE
- This information is generated by Artificial Intelligence (AI) and complex algorithms. While advanced, these systems can contain errors or inaccuracies and are for educational purposes only.
- Technical analysis provides no guarantees; this information is purely informative.
- All discussed scenarios are hypothetical and do not constitute predictions or expectations.
- Past performance is not an indicator of future results.
- This is not financial advice and is not intended as a call-to-action for the reader.
- No implicit direction is claimed, and no specific behavior of market participants is suggested.