
#1 Crypto Portfolio: Overview & Getting Started
The Crypto Portfolio tool lets you track the coins you own (or want to watch), see their live value, and get a quick read on how your positions are doing — all in one dashboard that you can rearrange to fit the way you trade.
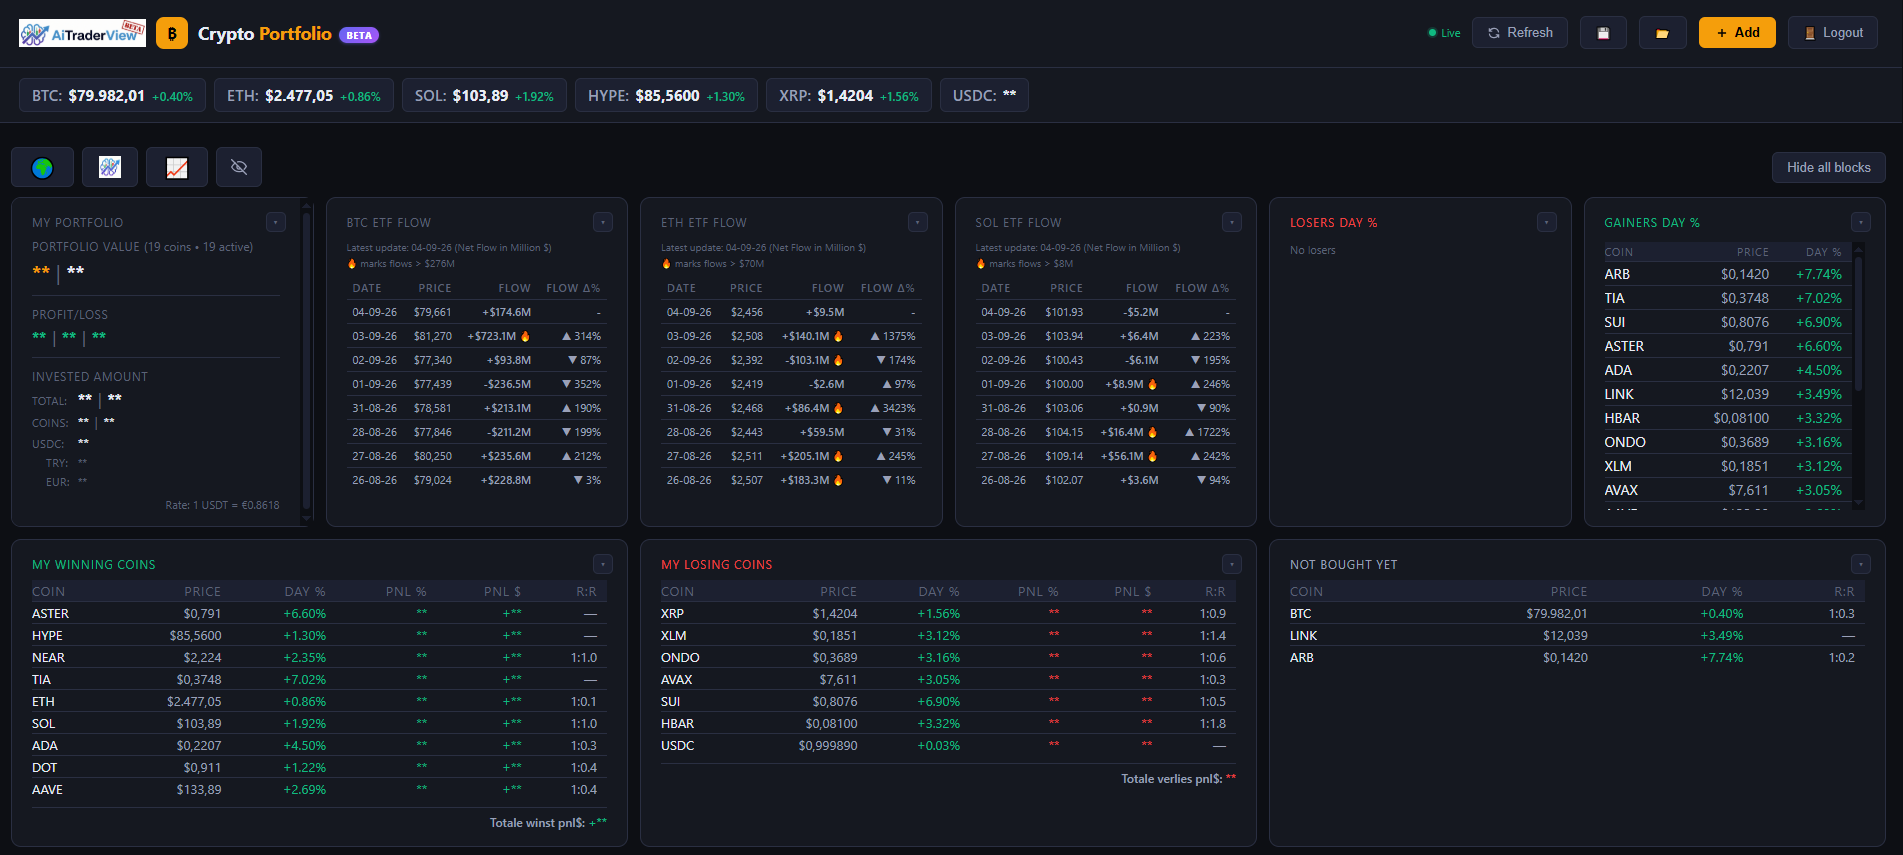
[SCREENSHOT: Full Crypto Portfolio dashboard, showing the coin table and the summary blocks above it]
## What you can do here
– Keep a record of the coins you hold: how much you entered, your average price, and your current profit or loss based on live market prices
– View prices pulled from major exchanges, refreshed automatically
– Enter a support and resistance level per coin, so the app can show you a calculated risk/reward figure
– Run a “what if I buy more” calculation to see how an extra purchase would change your average price
– Organize the dashboard into blocks (Portfolio, Allocation, Gainers, Losers, ETF Flow, and more) that you can drag, resize, or collapse
– Mark coins as favorites and filter your view by category
– Export your portfolio data as a backup, or import it on another device
All figures on this page — profit/loss, risk/reward, expected value, and simulations — are calculations based on the data you enter and on market prices as displayed. They are informational only and are not investment advice or a recommendation to buy or sell. Market prices, and the figures calculated from them, can change at any time.
## The building blocks of your dashboard
Your Crypto Portfolio page is made up of a coin table plus a set of optional summary blocks. By default you’ll see blocks like:
– **My Portfolio** — your full list of coins with live value and profit/loss
– **Expected Portfolio Value + Profit** — a projection based on the target prices you’ve set
– **Allocation (Current Value $)** — how your money is spread across your coins
– **Gainers Day %** / **Losers Day %** — your best and worst performers today
– **BTC / ETH / SOL ETF Flow** — daily inflow or outflow for the major crypto ETFs
– **My Winning Coins** / **My Losing Coins** — a quick split of what’s currently in profit versus in loss
– **Not bought yet** — coins you’re watching but haven’t added a position for yet
– **Support & Resistance** — your saved levels per coin
You don’t have to keep all of these visible — see the “Customizing your dashboard” article to learn how to show, hide, resize, and reorder them.
## Adding your first coin
- Click **Add** above the portfolio table.
- Pick a coin from the dropdown.
- Fill in how much you hold and how much you invested (in USDT, or enter an amount in Turkish Lira and it will be converted automatically at the current rate).
- Optionally set a support level, a resistance level, and a target price.
- Click **Save**.
Your coin now appears in the table with a live price, and the summary blocks update automatically.
For the full walkthrough of every field in this form — including targets, the buy simulator, and how support/resistance affects your risk/reward — see **”Adding & Editing Coins”**.
## Keeping prices up to date
Prices refresh automatically in the background. If you want the latest numbers immediately, click **Refresh** above the table. Prices are pulled from major exchanges, with a fallback source used if one exchange is briefly unavailable. Prices shown may be delayed and can differ slightly from the price on your own exchange or broker.
## Quick links, privacy, and help
Above the table, a small row of shortcuts gives you: 🌍 Crypto News, a link to Advanced Analysis, 📈 a link straight to Crypto Cockpit, and an eye icon to mask your portfolio amounts with placeholders (handy when sharing your screen — click again to reveal them). The **Hide all blocks** button next to it collapses every summary block at once. Click **❓ Help** at any time for a short interactive guided tour of the page.
## Where to go next
This overview covers the basics. For a deeper look at specific features, see:
– **Adding & Editing Coins** — the full add/edit form, targets, and the buy simulator
– **Customizing Your Dashboard** — rearranging, resizing, and hiding blocks and columns
– **Support & Resistance and Risk/Reward** — setting levels and reading the risk/reward numbers
– **ETF Flow Blocks** — what the BTC/ETH/SOL ETF flow numbers mean
– **Favorites, Filters & Categories** — organizing a large watchlist
– **Exporting, Importing & Syncing Your Data** — backing up your portfolio and using it across devices
⚠️ RISK WARNING & AI DISCLOSURE
- This information is generated by Artificial Intelligence (AI) and complex algorithms. While advanced, these systems can contain errors or inaccuracies and are for educational purposes only.
- Technical analysis provides no guarantees; this information is purely informative.
- All discussed scenarios are hypothetical and do not constitute predictions or expectations.
- Past performance is not an indicator of future results.
- This is not financial advice and is not intended as a call-to-action for the reader.
- No implicit direction is claimed, and no specific behavior of market participants is suggested.