
SMC indicator
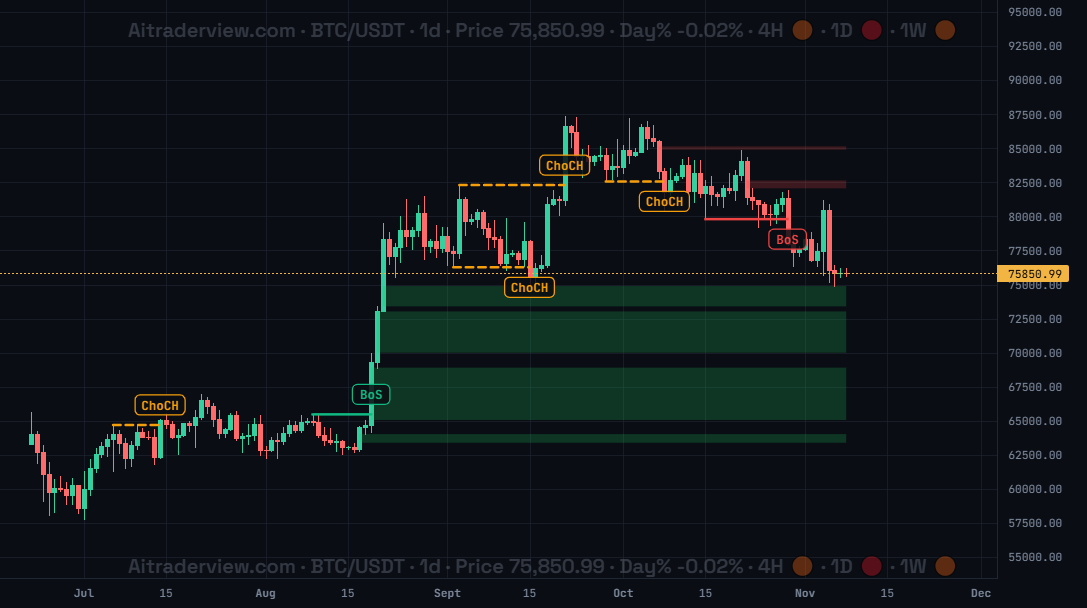
The screenshot shows BTC/USDT on the 1d timeframe with SMC switched on: BoS and ChoCH labels on the structure breaks, and green and red Fair Value Gap zones.
1. Overview
| Property | Details |
|---|---|
| Indicator name | SMC (Smart Money Concepts) |
| Category | Market structure |
| Type | Chart overlay (labels, lines and zones on the price chart) |
| Display | BoS and ChoCH labels with lines, plus optional Fair Value Gap zones and a Premium/Discount zone |
| Data | Price candles of the timeframe you are viewing |
| Availability | Basic indicator, off by default |
SMC stands for Smart Money Concepts. It is a way of reading the market through its structure: swing highs and lows, the breaks of those levels, and price gaps that were left behind. The SMC indicator draws these elements automatically on your chart.
2. Purpose of the indicator
What does it measure?
It follows the market structure. A swing high or low is confirmed after 5 candles on each side. When a candle closes beyond such a level, the indicator marks a structure break: BoS when the break goes in the direction of the current trend, ChoCH when it goes against it.
When do you use it?
- To see whether the market structure is bullish or bearish.
- To spot an early sign of a possible trend change (ChoCH).
- To see trend continuation (BoS).
- To find open price gaps (FVG) that price may return to.
- To judge whether price is in a premium or discount area of the current range.
3. How to read the indicator
- BoS (Break of Structure): price closes beyond a swing level in the direction of the current trend. This confirms the trend continues. Green for a bullish BoS, red for a bearish BoS.
- ChoCH (Change of Character): price closes beyond a swing level against the current trend. This is the first sign that the trend may be turning. It is drawn in orange with a dashed line.
- Lines: each label sits at the end of a line that starts at the swing level that was broken.
- FVG (Fair Value Gap): a gap between candle 1 and candle 3 that price has not filled yet. Green is a bullish gap, red is a bearish gap. The zone shrinks as price fills part of it and disappears when it is fully filled.
- Premium/Discount Zone: the range since the last ChoCH with a middle line (equilibrium). Price above the middle is premium, below is discount.
- Delay: a swing needs 5 candles on each side, so structure labels appear with a small delay.
4. Settings
| Setting | Default | Description |
|---|---|---|
| SMC | Off | Show or hide the SMC structure on the price chart. |
| FVG (Fair Value Gap) | Off | Show open price gaps as green (bullish) and red (bearish) zones. |
| BoS (Break of Structure) | On | Show the BoS labels and lines. |
| ChoCH (Change of Character) | On | Show the ChoCH labels and dashed lines. |
| Premium/Discount Zone | Off | Show the range since the last ChoCH with the equilibrium line. |
5. Tips and combinations
- Start with BoS and ChoCH only. Switch on FVG and the Premium/Discount Zone when you want extra detail.
- The 4h and 1d timeframes give the cleanest structure. On low timeframes there are many small breaks.
- A ChoCH is a first warning, not a confirmed reversal. Wait for a following BoS in the new direction.
- Open FVG zones close to price are interesting areas where price may react.
- Combine with the SuperTrend indicator for the trend direction, the Squeeze indicator for compression, and the Liquidation Heatmap for liquidity levels.
6. Disclaimer
This indicator and its data are for information only and are not financial advice.
Watch the Crypto Cockpit intro video:
Watch all our videos via this link:
https://aitraderview.com/youtube-videos/
⚠️ RISK WARNING & AI DISCLOSURE
- This information is generated by Artificial Intelligence (AI) and complex algorithms. While advanced, these systems can contain errors or inaccuracies and are for educational purposes only.
- Technical analysis provides no guarantees; this information is purely informative.
- All discussed scenarios are hypothetical and do not constitute predictions or expectations.
- Past performance is not an indicator of future results.
- This is not financial advice and is not intended as a call-to-action for the reader.
- No implicit direction is claimed, and no specific behavior of market participants is suggested.