
Squeeze indicator
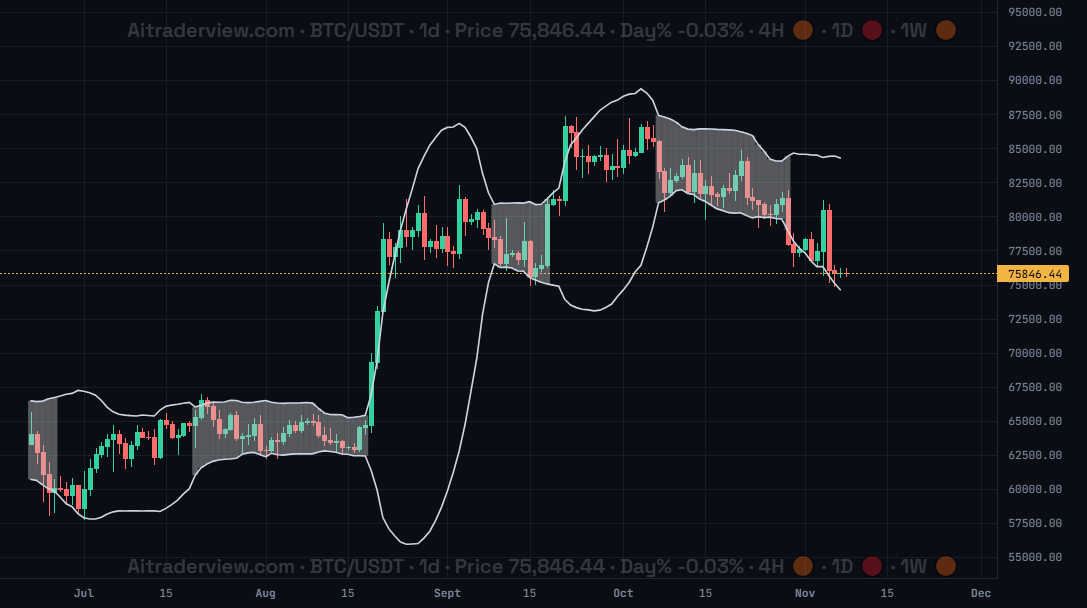
The screenshot shows BTC/USDT on the 1d timeframe with the Squeeze indicator on. The grey blocks mark the candles where a squeeze is active, and the white lines are the upper and lower band.
1. Overview
| Property | Details |
|---|---|
| Indicator name | Squeeze Check |
| Category | Volatility |
| Type | Chart overlay (blocks and lines on the price chart) |
| Display | Grey blocks where a squeeze is active, plus optional upper, mid and lower band lines |
| Data | Price candles of the timeframe you are viewing |
| Availability | Basic indicator, on by default |
A squeeze is a period in which price volatility becomes unusually low and the market is compressed like a spring. The Squeeze indicator shades these periods on the chart. Such quiet phases are often followed by a stronger move.
2. Purpose of the indicator
What does it measure?
It detects when the Bollinger Bands (20, 2.0) move inside the Keltner Channel (20, 1.5 x ATR). When that happens, volatility is compressed and the candle gets a grey block between the upper and lower band.
When do you use it?
- To spot phases of low volatility before a possible breakout.
- To see when a quiet range is building up energy.
- To judge whether a move is starting from compression or from an already volatile market.
- To prepare levels and alerts around a range that is being squeezed.
3. How to read the indicator
- Grey block: a squeeze is active on that candle. The longer the grey stretch, the stronger the compression.
- End of a grey stretch: the squeeze is released and a bigger move often starts. The indicator does not tell the direction, so wait for the candle to close beyond the range.
- Bands narrow: the upper and lower band move closer together when volatility falls.
- Bands widen: after a strong move the bands spread apart, as you can see after the grey blocks in the screenshot.
- Bands without a block: if you show the band lines, they are drawn on every candle, but only the grey blocks show that a squeeze is really active.
4. Settings
| Setting | Default | Description |
|---|---|---|
| Squeeze Check | On | Show or hide the grey squeeze blocks on the price chart. |
| Upperband | On | Show the upper band line. The color can be changed. |
| Midband | Off | Show the middle band line. The color can be changed. |
| Lowerband | On | Show the lower band line. The color can be changed. |
5. Tips and combinations
- Use the 4h and 1d timeframes for the most reliable squeezes. On very low timeframes they appear constantly and mean less.
- A squeeze only says that a bigger move is likely, not in which direction. Wait for a candle close outside the range before you act.
- Switch on the Midband when you want a central reference line for the average price.
- Combine with the SMC indicator to see structure breaks, and with the SuperTrend indicator to follow the direction after the squeeze.
- Add the Liquidation Heatmap to see where liquidity sits above and below the compressed range.
6. Disclaimer
This indicator and its data are for information only and are not financial advice.
Watch the Crypto Cockpit intro video:
Watch all our videos via this link:
https://aitraderview.com/youtube-videos/
⚠️ RISK WARNING & AI DISCLOSURE
- This information is generated by Artificial Intelligence (AI) and complex algorithms. While advanced, these systems can contain errors or inaccuracies and are for educational purposes only.
- Technical analysis provides no guarantees; this information is purely informative.
- All discussed scenarios are hypothetical and do not constitute predictions or expectations.
- Past performance is not an indicator of future results.
- This is not financial advice and is not intended as a call-to-action for the reader.
- No implicit direction is claimed, and no specific behavior of market participants is suggested.