
Session VWAP indicator
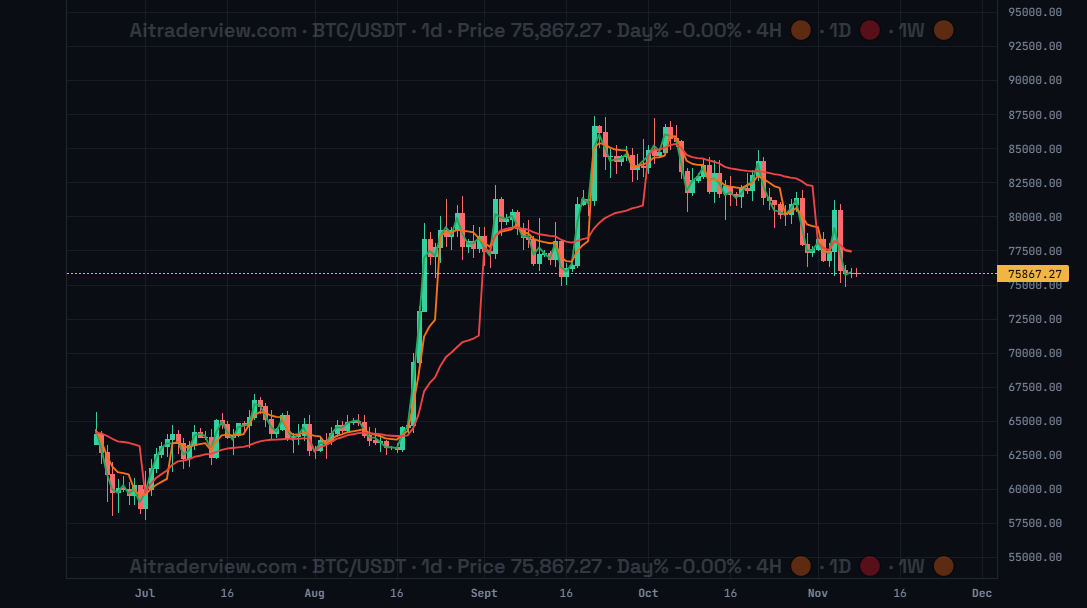
The screenshot shows BTC/USDT on the 1d timeframe with Session VWAP switched on. Notice how the lines restart at the beginning of each session.
1. Overview
| Property | Details |
|---|---|
| Indicator name | Session VWAP (Daily / Weekly / Monthly) |
| Category | Volume |
| Type | Chart overlay (lines on the price chart) |
| Display | Three lines: Daily VWAP (green), Weekly VWAP (orange) and Monthly VWAP (red) |
| Data | Price and volume data of the sessions |
| Availability | Basic indicator, off by default |
VWAP stands for volume weighted average price. It is the average price of a session in which every price is weighted by the volume that traded there. The Session VWAP indicator draws this average for the day, the week and the month, and starts a new line every time a new session begins.
2. Purpose of the indicator
What does it measure?
It measures the average price that traders paid during the session, weighted by volume. This makes it a reference for a fair price: where most of the volume changed hands.
When do you use it?
- To see whether price trades above or below the average price of the session.
- To use the VWAP as a dynamic support or resistance level.
- To judge whether buyers or sellers have the upper hand in the current day, week or month.
- To find areas where several VWAP lines come together.
3. How to read the indicator
- Daily VWAP (green) restarts every day (UTC).
- Weekly VWAP (orange) restarts every week (UTC, ISO week).
- Monthly VWAP (red) restarts every month (UTC).
- Price above a VWAP: buyers are in control of that session, and the VWAP often acts as support.
- Price below a VWAP: sellers are in control of that session, and the VWAP often acts as resistance.
- Restarts: at the start of a new session the line jumps to the new session’s starting price, so you see steps in the line. This is normal.
- Longer sessions move slower: the Monthly VWAP changes slowly, while the Daily VWAP follows price closely.
- Clusters: when two or three VWAP lines sit close together, that price area gets extra attention.
4. Settings
| Setting | Default | Description |
|---|---|---|
| Session VWAP | Off | Show or hide the VWAP lines on the price chart. |
| Daily VWAP | On (green) | Session VWAP that resets every day (UTC). |
| Weekly VWAP | On (orange) | Session VWAP that resets every week (UTC, ISO week). |
| Monthly VWAP | On (red) | Session VWAP that resets every month (UTC). |
| Line color | Per line | Choose the color of each line. |
| Line width | 1.5 (0.5 to 6) | Choose the thickness of each line. |
5. Tips and combinations
- The Daily VWAP is most useful on intraday timeframes such as 1h and 4h. On the 1d timeframe every candle is a full session of its own.
- Use the Weekly and Monthly VWAP as higher timeframe reference levels. Price often reacts around them.
- Hide the lines you do not need to keep the chart clean, for example keep only the Weekly and Monthly VWAP.
- A VWAP is a reference, not a guarantee. Wait for price action when price reaches the line.
- Combine with the EMA Trend indicator, Npoc’s or the Liquidation Heatmap to find levels where several signals meet.
6. Disclaimer
This indicator and its data are for information only and are not financial advice.
Watch the Crypto Cockpit intro video:
Watch all our videos via this link:
https://aitraderview.com/youtube-videos/
⚠️ RISK WARNING & AI DISCLOSURE
- This information is generated by Artificial Intelligence (AI) and complex algorithms. While advanced, these systems can contain errors or inaccuracies and are for educational purposes only.
- Technical analysis provides no guarantees; this information is purely informative.
- All discussed scenarios are hypothetical and do not constitute predictions or expectations.
- Past performance is not an indicator of future results.
- This is not financial advice and is not intended as a call-to-action for the reader.
- No implicit direction is claimed, and no specific behavior of market participants is suggested.