
SMA Trend indicator
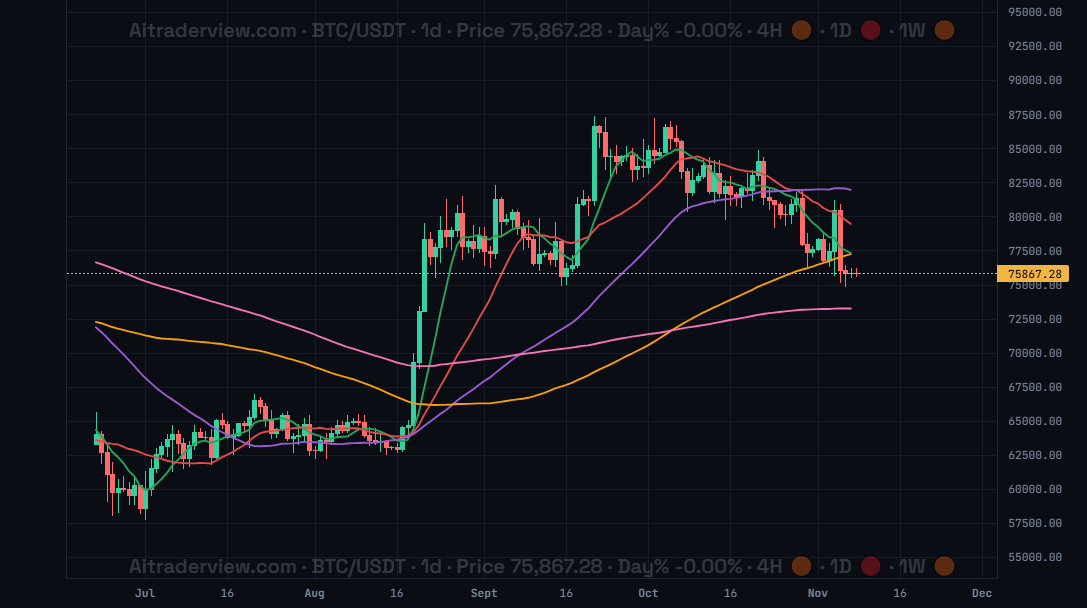
The screenshot shows BTC/USDT on the 1d timeframe with all five SMA lines switched on.
1. Overview
| Property | Details |
|---|---|
| Indicator name | SMA Trend (8/20/50/100/200) |
| Category | Trend |
| Type | Chart overlay (lines on the price chart) |
| Display | Five lines: SMA 8 (green), SMA 20 (red), SMA 50 (purple), SMA 100 (orange) and SMA 200 (pink) |
| Data | Price candles of the timeframe you are viewing |
| Availability | Basic indicator, off by default |
The SMA Trend indicator draws five simple moving averages on your price chart. A simple moving average (SMA) is the average price over the last N candles, where every candle counts equally. This makes the lines smoother and slower than an exponential moving average. Together the five lines show the trend on short, medium and long horizons.
2. Purpose of the indicator
What does it measure?
It measures the direction and strength of the trend by averaging the price over 8, 20, 50, 100 and 200 candles. The lines also act as dynamic support and resistance levels.
When do you use it?
- To see the trend direction at a glance.
- To find pullback areas in a trend, for example near the SMA 20 or SMA 50.
- To check the long-term bias against the SMA 200.
- To spot a possible trend change when short lines cross the longer lines.
3. How to read the indicator
- SMA 8 (green) and SMA 20 (red) show short-term momentum.
- SMA 50 (purple) is popular among swing traders.
- SMA 100 (orange) is a mid- to long-term trend reference.
- SMA 200 (pink) is viewed as the long-term trend line.
- Uptrend: price is above the lines, the lines are ordered from short (top) to long (bottom) and slope upwards.
- Downtrend: price is below the lines, the lines are ordered from long (top) to short (bottom) and slope downwards.
- Range: the lines are flat and tangled, and price crosses them again and again.
- Distance: when price is far above or below the lines, the move is stretched and a pullback toward the lines becomes more likely.
4. Settings
| Setting | Default | Description |
|---|---|---|
| SMA Trend | Off | Show or hide the five SMA lines on the price chart. |
| SMA 8 | On (green) | Show or hide this line. Shows short-term momentum. |
| SMA 20 | On (red) | Show or hide this line. Shows short-term momentum. |
| SMA 50 | On (purple) | Show or hide this line. Popular among swing traders. |
| SMA 100 | On (orange) | Show or hide this line. A mid- to long-term trend reference. |
| SMA 200 | On (pink) | Show or hide this line. The long-term trend indicator. |
| Line color | Per line | Choose the color of each line. |
| Line width | 1.5 (0.5 to 6) | Choose the thickness of each line. |
5. Tips and combinations
- SMAs follow price with a delay, so use them for context rather than as an entry signal on their own.
- Hide the lines you do not need to keep the chart clean, for example keep only SMA 50 and SMA 200.
- Compare with the EMA Trend indicator, which uses the same periods but reacts faster because it weights recent candles more. When both agree, the trend picture is clearer.
- In a trend, price often pulls back to the SMA 20 or SMA 50. Wait for a reaction before acting, because the lines are not guaranteed support or resistance.
- Combine with the Liquidation Heatmap or Npoc’s to find levels where the trend may pause.
6. Disclaimer
This indicator and its data are for information only and are not financial advice.
Watch the Crypto Cockpit intro video:
Watch all our videos via this link:
https://aitraderview.com/youtube-videos/
⚠️ RISK WARNING & AI DISCLOSURE
- This information is generated by Artificial Intelligence (AI) and complex algorithms. While advanced, these systems can contain errors or inaccuracies and are for educational purposes only.
- Technical analysis provides no guarantees; this information is purely informative.
- All discussed scenarios are hypothetical and do not constitute predictions or expectations.
- Past performance is not an indicator of future results.
- This is not financial advice and is not intended as a call-to-action for the reader.
- No implicit direction is claimed, and no specific behavior of market participants is suggested.