
Npoc’s indicator
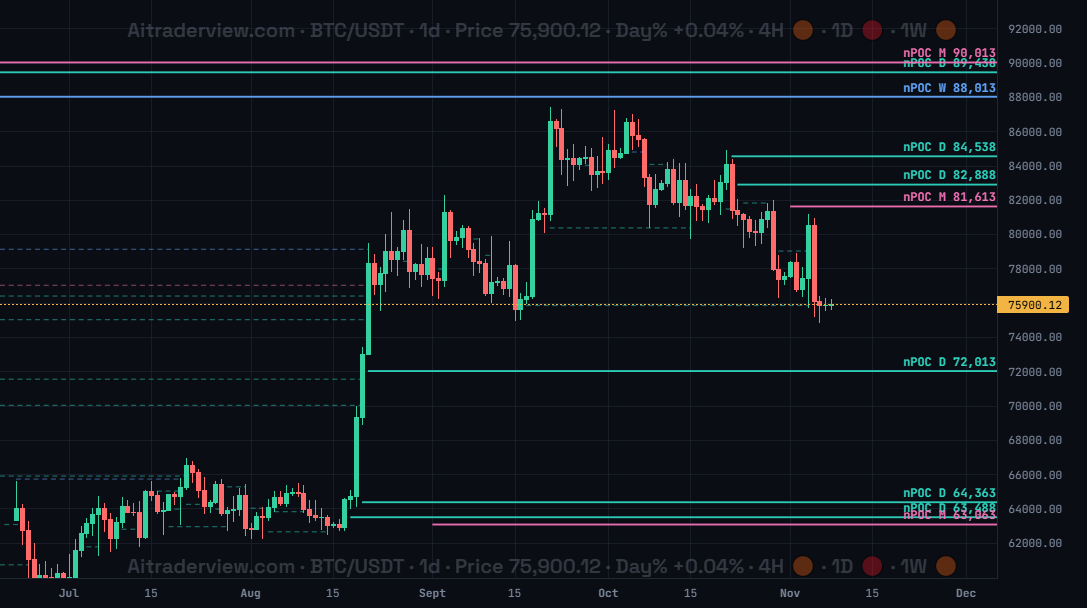
The screenshot shows BTC/USDT on the 1d timeframe with Npoc’s switched on and Show tested nPOC’s enabled, so the dashed lines on the left are levels that were tested later.
1. Overview
| Property | Details |
|---|---|
| Indicator name | Npoc’s |
| Category | Volume profile |
| Type | Chart overlay (horizontal lines on the price chart) with an optional table |
| Display | Horizontal lines with a label at the right edge, for example “nPOC D 84,538” |
| Data | Volume profiles of daily, weekly and monthly sessions |
| Availability | Advanced indicator, off by default |
A point of control (POC) is the price level where the most volume traded during a session. When price has not come back to that level afterwards, the POC is called naked (nPOC). Npoc’s draws these untested levels from daily, weekly and monthly sessions on your chart, because price often returns to test them.
2. Purpose of the indicator
What does it measure?
It finds the highest-volume price of each daily, weekly and monthly session and tracks whether price has returned to it. As long as price has not touched the level, it stays on the chart as an open nPOC. The optional table also shows how these levels behaved in the past.
When do you use it?
- To find price levels where price may come back to, as targets or as areas of interest.
- To see which levels have already been tested and which are still open.
- To check how often nPOC’s of a coin were tested, and how quickly.
- To combine volume-based levels with support and resistance.
3. How to read the indicator
- Teal lines (D) are daily nPOC’s, blue lines (W) are weekly and pink lines (M) are monthly.
- The label at the right edge shows the period and the price, for example “nPOC W 88,013”.
- Solid lines are open (untested) nPOC’s. Only levels within 20% of the current price are drawn, from the moment they were created to the right edge of the chart.
- Dashed, faded lines are tested nPOC’s. They run from creation to the candle that tested them. They are only shown when you enable Show tested nPOC’s.
- Table (optional): for each period (Daily, Weekly, Monthly) and in total, it shows how many levels were Created, Tested and are still Open, how many are Open ±20% of the price, the Tested % of created levels, the Median test (median time from creation to test) and the Bounce (share of tested levels where price bounced).
4. Settings
| Setting | Default | Description |
|---|---|---|
| Npoc’s | Off | Show or hide the indicator on the price chart. |
| Show nPOC’s | On | Untested nPOC’s within 20% of the current price, drawn from creation to the right edge. |
| Show tested nPOC’s | Off | nPOC’s that were tested later, drawn dashed from creation to the candle that tested them. |
| Show table | Off | Show a table with how many nPOC’s were created, tested and are still open. |
5. Tips and combinations
- Treat an open nPOC as an area of interest, not a guarantee. Wait for price action when price reaches it.
- Switch on Show table to see on this coin and timeframe how often levels were tested, how fast, and how often price bounced.
- Several nPOC’s close together, especially from different periods, form a stronger area than a single line.
- Combine with the Liquidation Heatmap and the Orderbook Heatmap to see whether liquidations and resting orders sit at the same price.
6. Disclaimer
This indicator and its data are for information only and are not financial advice.
Watch the Crypto Cockpit intro video:
Watch all our videos via this link:
https://aitraderview.com/youtube-videos/
⚠️ RISK WARNING & AI DISCLOSURE
- This information is generated by Artificial Intelligence (AI) and complex algorithms. While advanced, these systems can contain errors or inaccuracies and are for educational purposes only.
- Technical analysis provides no guarantees; this information is purely informative.
- All discussed scenarios are hypothetical and do not constitute predictions or expectations.
- Past performance is not an indicator of future results.
- This is not financial advice and is not intended as a call-to-action for the reader.
- No implicit direction is claimed, and no specific behavior of market participants is suggested.