
Monthly Returns indicator
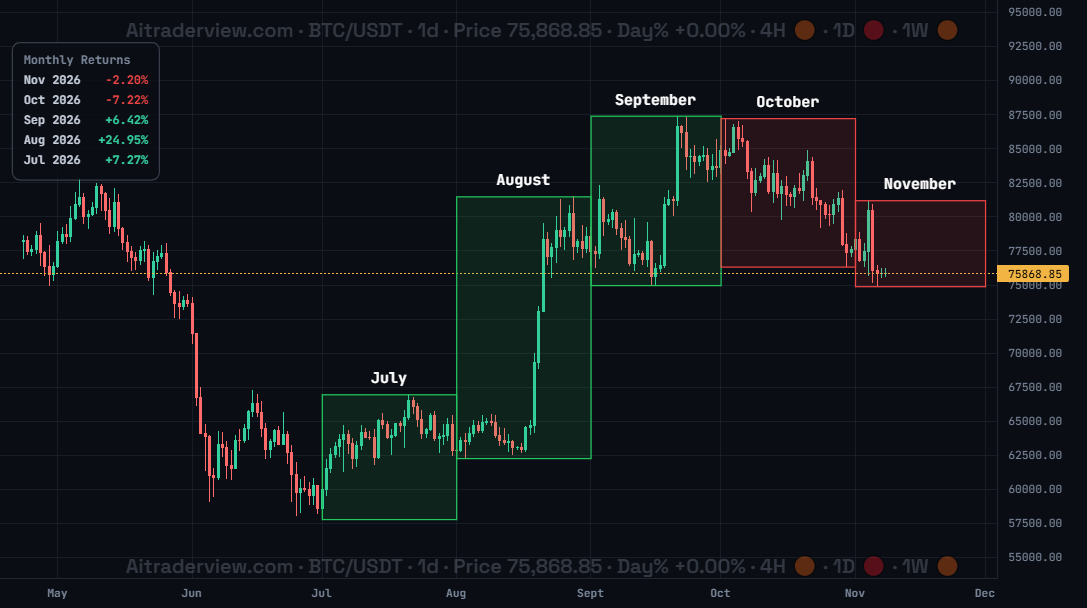
The screenshot shows BTC/USDT on the 1d timeframe with the Monthly Returns indicator set to 5 months. You can choose between 1 and 12 months.
1. Overview
| Property | Details |
|---|---|
| Indicator name | Monthly Returns |
| Category | Performance |
| Type | Chart overlay (rectangles drawn on the price chart) with an optional table |
| Display | One rectangle per month with the month name above it, and a table with the percentage return of each month in the top left of the chart |
| Data | Daily candles, grouped into calendar months |
| Availability | Advanced indicator, off by default |
The Monthly Returns indicator shows how the price performed in each calendar month. Every month gets a green rectangle when it closed higher than it opened and a red rectangle when it closed lower. At a glance you see the monthly trend, the size of each move and how the current month compares with the previous ones.
2. Purpose of the indicator
What does it measure?
It measures the return of each calendar month: the percentage change from the first open of the month to the last close. For the current month this is the return so far.
When do you use it?
- To see the monthly trend and spot a streak of green or red months.
- To compare the current month with previous months.
- To judge how much of a monthly range has already been used.
- To add context on the 1d and 1w timeframes.
3. How to read the indicator
- Green rectangle: the month closed higher than it opened (positive return).
- Red rectangle: the month closed lower than it opened (negative return).
- Rectangle height: it spans from the lowest low to the highest high of that month, so a tall rectangle means a wide monthly range.
- Month name: shown above each rectangle.
- Table: lists the return of each month in percent, with the latest month first. Positive values are green and negative values are red.
- Current month: its rectangle and percentage keep updating until the month ends.
- Months follow the calendar (UTC), and the data comes from daily candles, so the result is the same on every timeframe.
4. Settings
| Setting | Default | Description |
|---|---|---|
| Monthly Returns | Off | Show or hide the indicator on the price chart. |
| Months | 3 (1 to 12) | Number of months to show, counting back from the current month. |
| Show table | On | Show the table with the monthly returns in percent in the top left of the chart. |
5. Tips and combinations
- A long streak of green or red months shows momentum, but streaks end. Do not treat the pattern as a signal on its own.
- Use 12 months to see the bigger picture, or 3 months for a cleaner chart.
- A month that closes near the top or bottom of its rectangle shows a strong close. A close in the middle shows indecision.
- Combine with trend, support and resistance, or the Liquidation Heatmap to find where the next move may stall.
6. Disclaimer
This indicator and its data are for information only and are not financial advice.
Watch the Crypto Cockpit intro video:
Watch all our videos via this link:
https://aitraderview.com/youtube-videos/
⚠️ RISK WARNING & AI DISCLOSURE
- This information is generated by Artificial Intelligence (AI) and complex algorithms. While advanced, these systems can contain errors or inaccuracies and are for educational purposes only.
- Technical analysis provides no guarantees; this information is purely informative.
- All discussed scenarios are hypothetical and do not constitute predictions or expectations.
- Past performance is not an indicator of future results.
- This is not financial advice and is not intended as a call-to-action for the reader.
- No implicit direction is claimed, and no specific behavior of market participants is suggested.