
FnG2 Attention Metric indicator
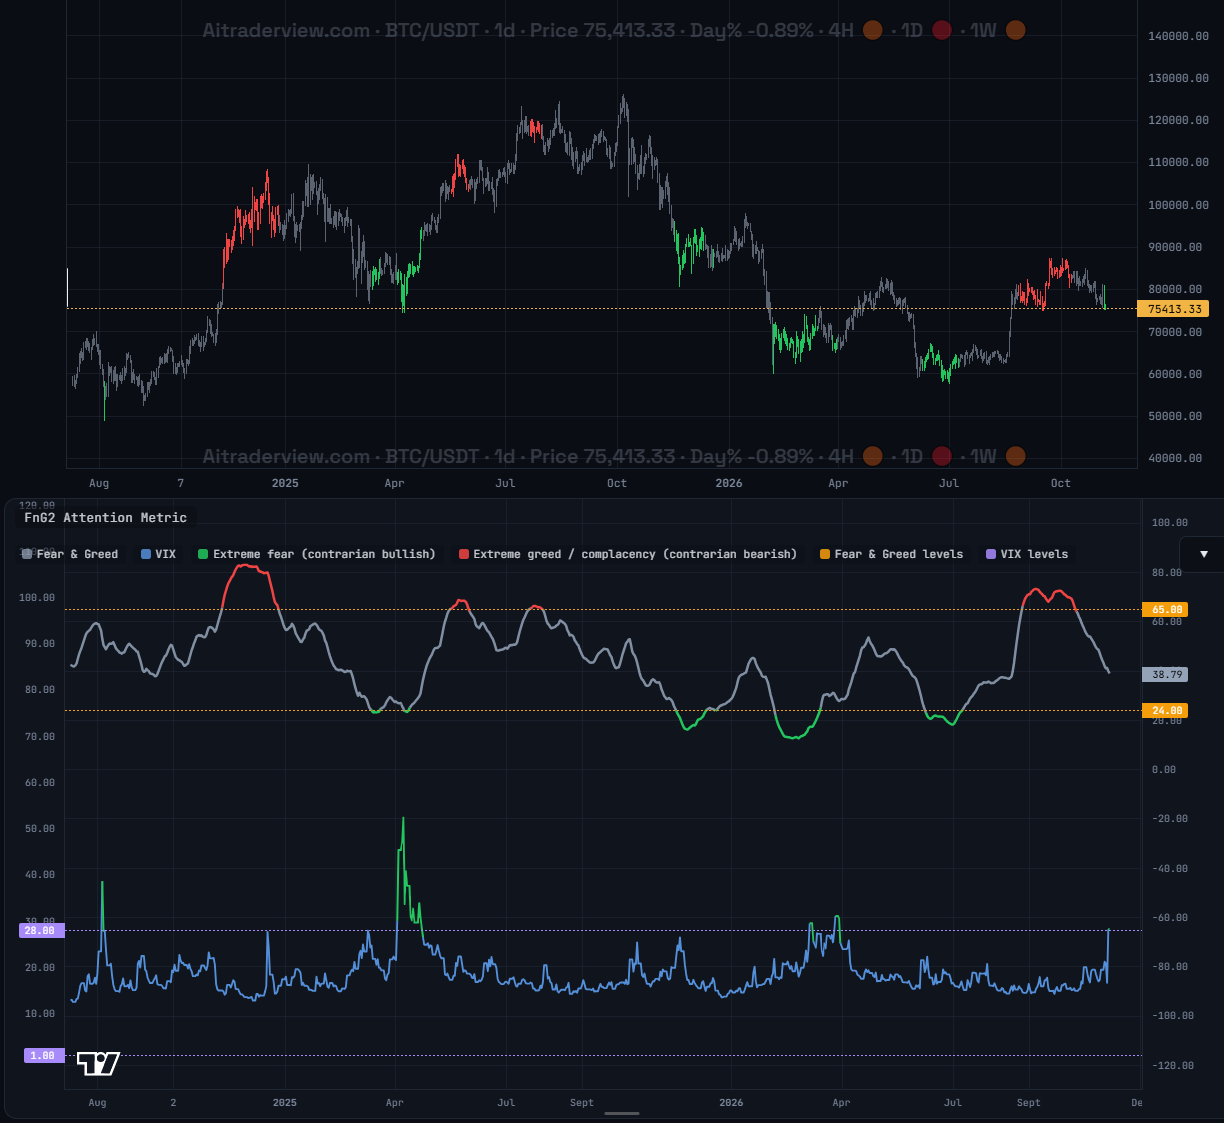
The screenshot uses custom levels (Fear & Greed 65 and 24, VIX 28 and 1). You can set your own values.
1. Overview
| Property | Details |
|---|---|
| Indicator name | FnG2 Attention Metric |
| Category | Sentiment |
| Type | Pane indicator (separate panel below the price chart) |
| Display | Two lines in one panel: Fear & Greed (grey) and VIX (blue) |
| Data | Daily Fear & Greed index and daily VIX values |
| Availability | Advanced indicator, off by default |
The FnG2 Attention Metric combines two sentiment gauges in one panel: the crypto Fear & Greed index and the VIX, the volatility index of the US stock market. It marks extreme readings on both lines and can color the candles on your price chart to match.
2. Purpose of the indicator
What does it measure?
It measures how much fear or complacency is in the market. Extreme fear often appears near local lows, and extreme greed or complacency often appears near local highs. The indicator is therefore contrarian: it highlights the moments when the crowd is most one-sided.
When do you use it?
- To spot possible turning points on higher timeframes.
- To check whether a price move happens in a fearful or an overheated market.
- As a filter next to your other Crypto Cockpit indicators, not as a stand-alone entry signal.
3. How to read the indicator
- Grey line: the Fear & Greed index (0 to 100). Low means fear, high means greed.
- Blue line: the VIX. A high VIX means stress and panic, a very low VIX means complacency.
- Green segments (extreme fear, contrarian bullish): Fear & Greed at or below its lower level, or VIX at or above its upper level.
- Red segments (extreme greed or complacency, contrarian bearish): Fear & Greed at or above its upper level, or VIX at or below its lower level.
- Dashed lines: the upper and lower levels you set. Orange is for Fear & Greed, purple for VIX.
- Candle coloring: a candle turns green when at least one line is in a green zone and none is in a red zone. It turns red in the opposite case. If both signals conflict, or neither is extreme, the candle stays grey.
The sentiment values are daily. On shorter timeframes such as 1h or 4h, every candle of a day uses that day’s value.
4. Settings
Settings are stored per timeframe (1h, 4h, 1d and 1w), so you can use different levels on each timeframe. Fear & Greed and VIX each have their own set.
| Setting | Fear & Greed (default) | VIX (default) | Description |
|---|---|---|---|
| Enabled | On | On | Show or hide this line. |
| EMA length | 14 (1 to 200) | 1 (1 to 200) | Smoothing of the daily values. A higher number gives a calmer line and later signals. 1 means no smoothing. |
| Upper level | 79 (51 to 100) | 30 (5 to 150) | Fear & Greed: at or above this is extreme greed (red). VIX: at or above this is extreme fear (green). |
| Lower level | 24 (0 to 49) | 13 (1 to 100) | Fear & Greed: at or below this is extreme fear (green). VIX: at or below this is complacency (red). |
| Color candles | On | On | Color the price candles based on this line. |
5. Tips and combinations
- The signals are slow. Use them as context on the 1d and 1w timeframes rather than for scalping.
- Extreme readings can last for weeks in strong trends. Wait for confirmation from price action or other indicators before acting.
- Lower the upper level and raise the lower level for more signals, or do the opposite for fewer but stronger ones.
- Switch off one of the two lines if you only want to follow crypto sentiment or only market volatility.
6. Disclaimer
This indicator and its data are for information only and are not financial advice.
Watch the Crypto Cockpit intro video:
Watch all our videos via this link:
https://aitraderview.com/youtube-videos/
⚠️ RISK WARNING & AI DISCLOSURE
- This information is generated by Artificial Intelligence (AI) and complex algorithms. While advanced, these systems can contain errors or inaccuracies and are for educational purposes only.
- Technical analysis provides no guarantees; this information is purely informative.
- All discussed scenarios are hypothetical and do not constitute predictions or expectations.
- Past performance is not an indicator of future results.
- This is not financial advice and is not intended as a call-to-action for the reader.
- No implicit direction is claimed, and no specific behavior of market participants is suggested.