
Crypto Screener: 8 Smart Tools to Scan the Market at a Glance
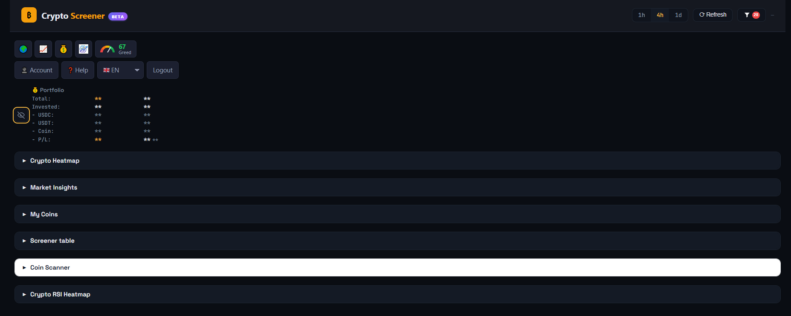
One Screen for the Whole Market
Checking 30+ coins one chart at a time takes hours. Crypto Screener puts every tracked coin side by side — trend, structure, momentum, real money flow and whale behavior — so you can see in seconds which coins deserve a closer look. One click on a coin opens it in Crypto Cockpit.
8 Tools in One Screener
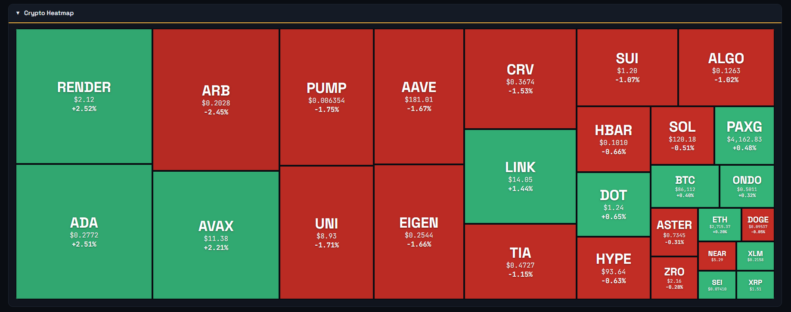
1. Crypto Heatmap — every tracked coin as a tile, sized by its day move, green up and red down.
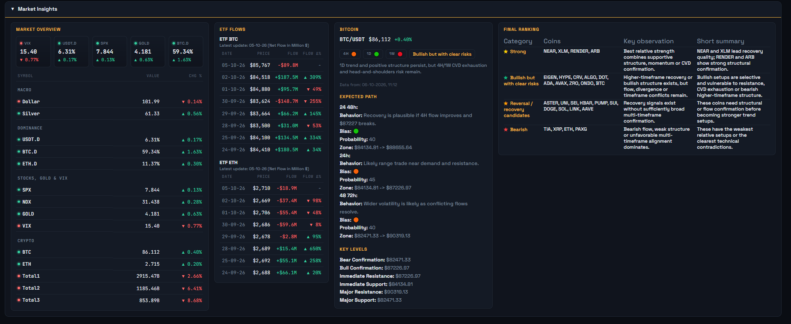
2. Market Insights — Market Overview (VIX, USDT.D, SPX, Gold, BTC.D and more), BTC and ETH ETF Flows, a Bitcoin block with the AI Expected Path and Key Levels, and the AI Final Ranking.
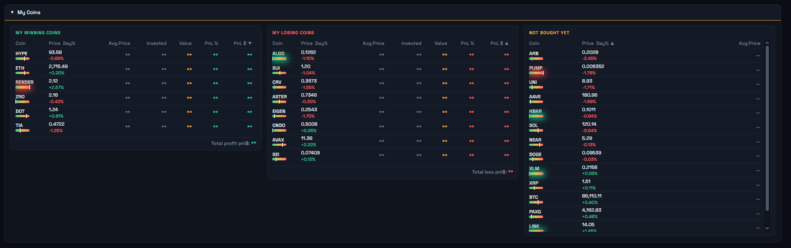
3. My Coins — your portfolio coins split into winning, losing and not bought yet, plus a live portfolio summary.
4. Screener Table — one row per coin with price, support/resistance meter, regime badge and score, anchor levels and 4H/1D/1W trend.
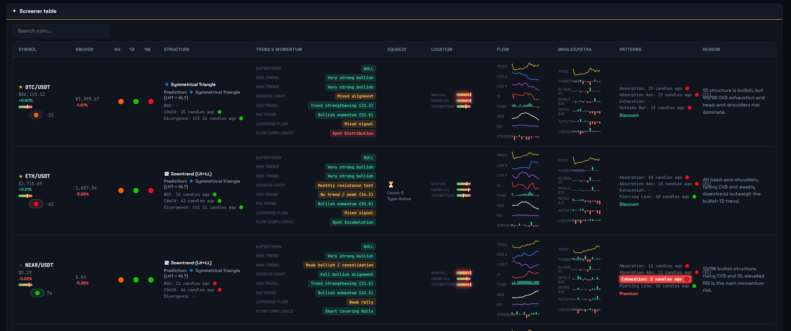
5. Structure, Trend & Momentum — BOS, CHoCH and divergences, SuperTrend, EMA, SMA, VWAP, ADX, RSI, Leverage Flow, Flow Confluence, squeeze and location in the range.
6. Flow, Whales/Retail & Patterns — mini charts of CVD, Open Interest, Funding, whale versus retail buying, liquidations and order-flow footprint signals.
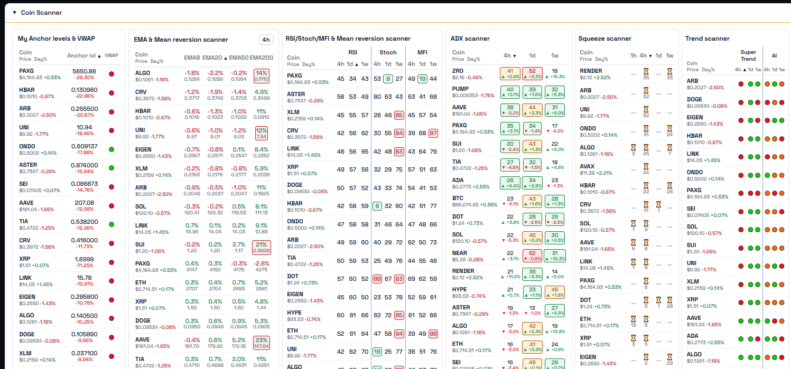
7. Coin Scanner — six scanner tables: anchor levels and VWAP, EMA, RSI/Stoch/MFI, ADX, Squeeze and Trend.
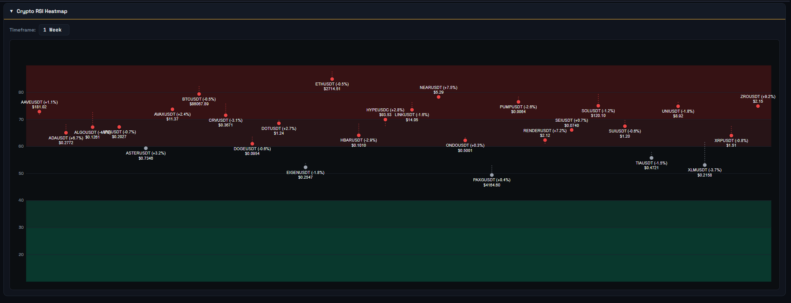
8. Crypto RSI Heatmap — the RSI of every coin on 4h, 1d, 1w or 1M in one chart.
Screener, Cockpit and Portfolio Work Together
The Screener finds the coins worth a look, Crypto Cockpit lets you analyze them in depth, and Crypto Portfolio tracks how your positions are doing. All three are free and use one account.
Disclaimer: Crypto Screener, its rankings, regime scores and all data are for information only and are not financial advice or a recommendation to buy or sell. Data can be delayed and change at any time. Crypto trading involves risk.
⚠️ RISK WARNING & AI DISCLOSURE
- This information is generated by Artificial Intelligence (AI) and complex algorithms. While advanced, these systems can contain errors or inaccuracies and are for educational purposes only.
- Technical analysis provides no guarantees; this information is purely informative.
- All discussed scenarios are hypothetical and do not constitute predictions or expectations.
- Past performance is not an indicator of future results.
- This is not financial advice and is not intended as a call-to-action for the reader.
- No implicit direction is claimed, and no specific behavior of market participants is suggested.