
💡 AiTraderView App – A Comprehensive Market Intelligence Platform
AiTraderView: A Complete Crypto Market Intelligence Suite
In the complex landscape of cryptocurrency markets, traders often manage fragmented tools — one app for charts, another for tracking their portfolio, a third for sentiment, and a fourth for orderflow. AiTraderView addresses this fragmentation by consolidating everything into one connected suite: Crypto Cockpit for charting and analysis, Crypto Portfolio for tracking your holdings, Crypto Screener for scanning the whole market at a glance, and the Advanced Analytics App for deep institutional-grade market intelligence.
This article walks through all four, starting with the three tools most traders will live in day to day.
📈 Crypto Cockpit: Your All-in-One Charting Command Center
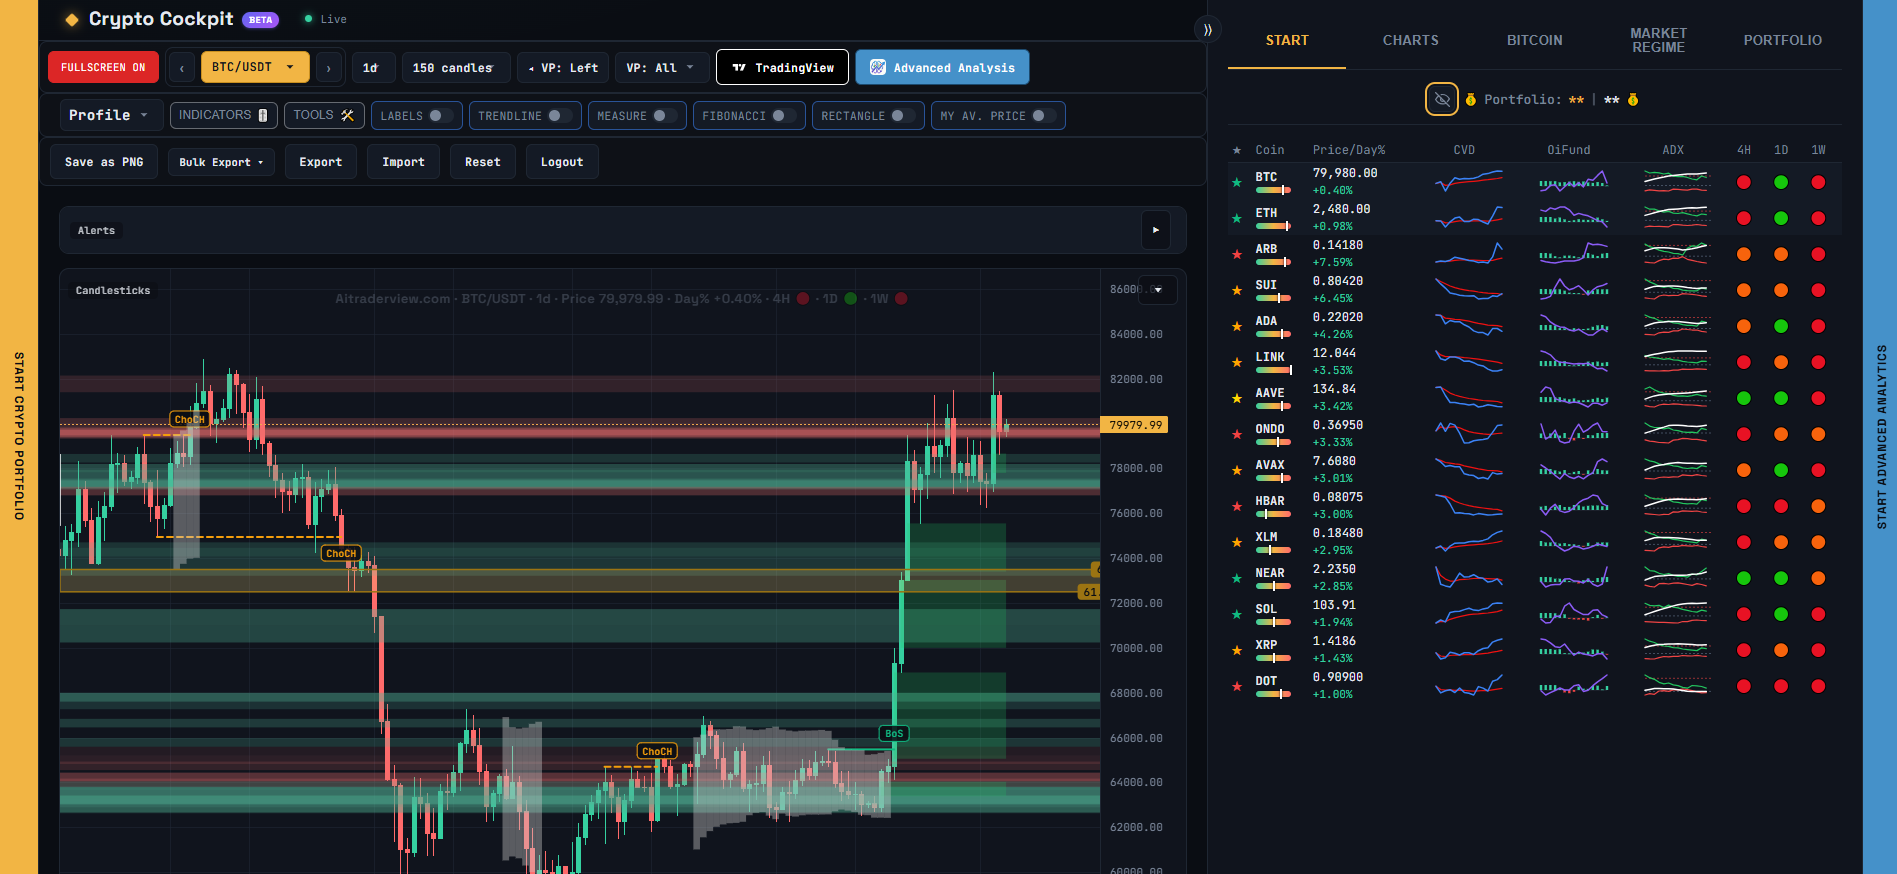
Crypto Cockpit is the heart of AiTraderView — a full charting workspace that combines a live candlestick chart, a huge library of technical indicators, your own price levels, and several tabs of automated market analysis, all in a single screen you can come back to every day.
Instead of juggling tabs for charting, indicators, alerts, and market context, Cockpit puts it all in one place:
- 🎚️ A deep indicator library: EMA/SMA trend stacks, Session VWAP, Trend Structure (HH/HL/LH/LL), Smart Money Concepts (FVG, Break of Structure, Change of Character), Premium/Discount zones, candlestick pattern recognition, Squeeze Check, and an Orderbook Heatmap — all directly on your candlesticks.
- 📊 12+ panel indicators: PowerTrades, Whale Buy/Sell ratios, CVD & momentum, Open Interest & funding, Top Long/Short account ratios, RSI, ADX, Squeeze Momentum, Relative Volume, and more — each assignable to its own panel and fully reorderable.
- 🔔 Automated Alerts: a live notification bar above the chart that flags momentum shifts, key VWAP tests, and overextended price conditions the moment they happen — no manual watching required.
- 📍 Your own levels, plus everyone else’s: pin your own support/resistance, pull in API-suggested levels, and — through the Social Traders Hub — see the pinned levels of traders you follow appear directly on your chart.
- 🧭 A full market overview, without leaving the chart: a Start tab scanning every coin you track at once, a Bitcoin-focused 72H intelligence briefing, and a Market Regime tab reading the entire market’s bullish/neutral/bearish state.
- 🖼️ One-click PNG export (single or bulk, across coins and indicator variants), full JSON export/import of your settings, and reusable Indicator Profiles so you can switch your entire setup in one click.
- 🔗 Side panels for Crypto Portfolio and Advanced Analytics that slide open right next to the chart, so you can check your positions or dig into deeper analytics without ever leaving Cockpit.
- 🌐 The Social Traders Hub: build a public trader profile, get discovered by other users, and follow the traders whose read on the market you trust. Once approved, their pinned support/resistance levels appear directly on your own Cockpit chart — right next to your own analysis.
- 📍 Your own levels, plus everyone else’s: pin your own support/resistance and pull in API-suggested levels alongside the shared levels from traders you follow.
🔥 New: the Social Traders Hub. This is the feature we’re most excited about — a public trading network built directly into Cockpit. Set up your trader profile, make it discoverable, and start following the traders whose levels you want to see. Every level a trader you follow shares gets pinned straight onto your own chart the moment they approve you. Whether you’re an experienced trader looking to build a following, or you’re still learning to read a chart and want to see how sharper traders draw their levels — this is the single easiest way to make Cockpit smarter, and it costs nothing to set up.
👉 Set up your trader profile on the Social Traders Hub
Whether you’re a full-time trader who needs institutional-grade tools in one window, or you’re just getting comfortable reading a chart, Crypto Cockpit is designed to be the one screen you open first every day. It’s free to use — there’s no reason not to make it your starting point.
💼 Crypto Portfolio: Track, Manage, and Optimize Your Holdings
Crypto Portfolio is where you keep track of what you actually own — a live dashboard that shows your positions, your profit and loss, and how your portfolio is allocated, updated automatically as the market moves.
- 💰 Live position tracking: log how much you hold and how much you invested, and see your average price, current value, and profit/loss update in real time from live prices.
- 🎯 Target prices & a built-in buy simulator: set a target as a price, a percentage gain, or a dollar value, and use the “what if I buy more” simulator to see how an additional purchase would change your average price — before you make it.
- 🛡️ Support/Resistance-based Risk/Reward: set your own support and resistance per coin and Crypto Portfolio automatically calculates a risk/reward ratio, so you can see at a glance which positions offer the best setup.
- 🧩 A fully modular dashboard: drag, resize, and reorder blocks like Allocation, Gainers/Losers, ETF Flow, My Winning/Losing Coins, and Support & Resistance — with separate layouts remembered for desktop and mobile.
- 🏦 BTC / ETH / SOL ETF Flow tracking: daily net inflow and outflow for the major spot crypto ETFs, right on your dashboard — a widely watched read on institutional interest.
- ⭐ Smart filters: star-based categories like “Best bullish setup,” “Best risk/reward setup,” and “Best recovery/reversal candidate,” generated from AiTraderView’s own market analysis, so a large watchlist stays easy to navigate.
- ☁️ Synced across devices, with one-click JSON export/import whenever you want a personal backup.
Crypto Portfolio isn’t just a tracker — paired with Crypto Cockpit’s “My Av. Price” chart overlay and shared Support/Resistance levels, your positions and your charts stay in sync automatically. Whether you’re managing a serious multi-coin book or just keeping an eye on your first few positions, this is the dashboard that keeps you honest about how you’re actually doing. It’s completely free.
🔍 Crypto Screener: Scan the Whole Market at a Glance
Crypto Screener puts every tracked coin side by side in one screen, so you can see in seconds which coins deserve a closer look — instead of checking 30+ charts one at a time. Scan on 1h, 4h or 1d, then open any coin in Crypto Cockpit with a single click.
- 🗺️ Crypto Heatmap: every tracked coin as a tile, sized by its day move, green up and red down.
- 🌐 Market Insights: VIX, BTC dominance, SPX, gold, ETF flows, the AI Expected Path for Bitcoin and an AI coin ranking from strong to bearish.
- 📋 Screener Table: one row per coin with price, support/resistance meter, regime badge and score, anchor levels and 4H/1D/1W trend.
- 🧱 Structure, trend and momentum: BOS, CHoCH and divergences, SuperTrend, EMA/SMA, VWAP, ADX, RSI, squeeze and the coin’s location in its range.
- 🐋 Flow, whales and retail: mini charts of CVD, Open Interest and funding, whales versus retail buying, liquidations and order-flow patterns.
- 🔎 Coin Scanner and RSI Heatmap: six scanner tables plus the RSI of every coin on 4h, 1d, 1w or 1M in one chart.
The Screener finds the coins worth a look, Crypto Cockpit lets you analyze them in depth, and Crypto Portfolio tracks how your positions are doing. All three are free and use one account.
Disclaimer: Crypto Screener, its rankings, regime scores and all data are for information only and are not financial advice or a recommendation to buy or sell. Data can be delayed and change at any time. Crypto trading involves risk.
What is the Advanced Analytics App?
Alongside Cockpit and Portfolio sits the Advanced Analytics App — a professional-grade Market Intelligence Application built for traders who prioritize structure and data hygiene. It functions as a decision-support system, designed to analyze market structure, momentum, liquidity, and derivatives pressure across multiple timeframes.
Rather than a simple collection of indicators, the platform aggregates diverse data streams into a coherent environment, aiming to reduce noise and enhance analytical clarity.
What Makes the Advanced Analytics App Different?
Many platforms focus on singular market dimensions. AiTraderView integrates multiple aspects of analysis—technical charting, orderflow, derivatives data, and macro correlations—into one dashboard.
A key differentiator is the automation of technical analysis. Unlike standard charting platforms requiring manual plotting, AiTraderView utilizes algorithms to identify key market structures automatically. It is designed to act as an analytical assistant (“Co-Pilot”), ensuring users have access to a complete overview of market conditions before engaging.
Key Features of the Advanced Analytics App
1. 📊 Automated Technical Analysis
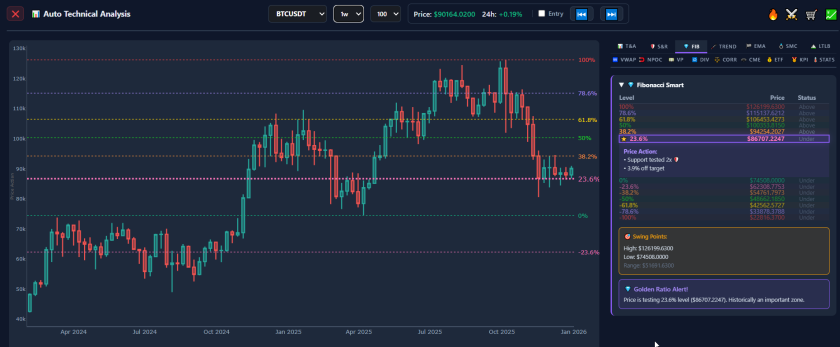
Institutional market movements often leave technical footprints. AiTraderView App uses algorithms to detect these patterns, automating the generation of:
- 🛡️ S&R: Automated Support and Resistance levels
- 💎 FIB: Automated Fibonacci Retracements
- 💍 SMC: Smart Money Concepts (Structure mapping)
- 🧲 NPOC: Naked Point of Control
- 💵 VP: Volume Profile
- 🔁 DIV: Divergences (RSI/MACD)
- 🌡️ STATS & CORR: Statistical Volatility and Correlation metrics
All calculations are multi-timeframe aware, dynamically adjusting as market conditions shift to ensure consistent analysis.
2. 🚦 KPI Indicators (Smart Engines)
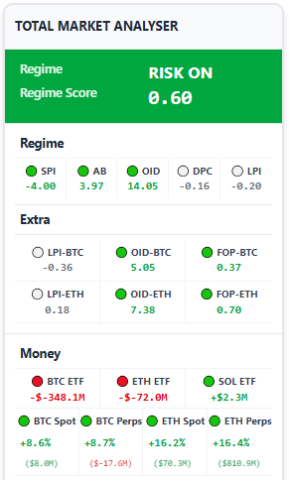
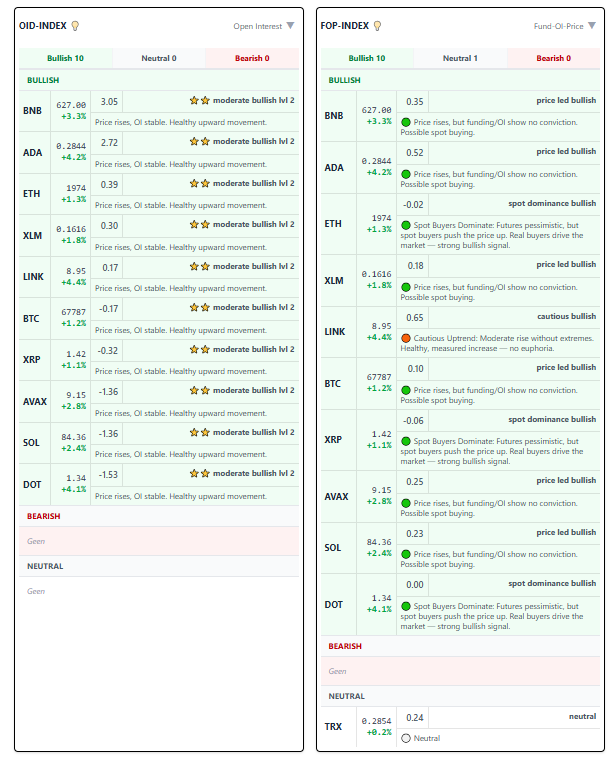
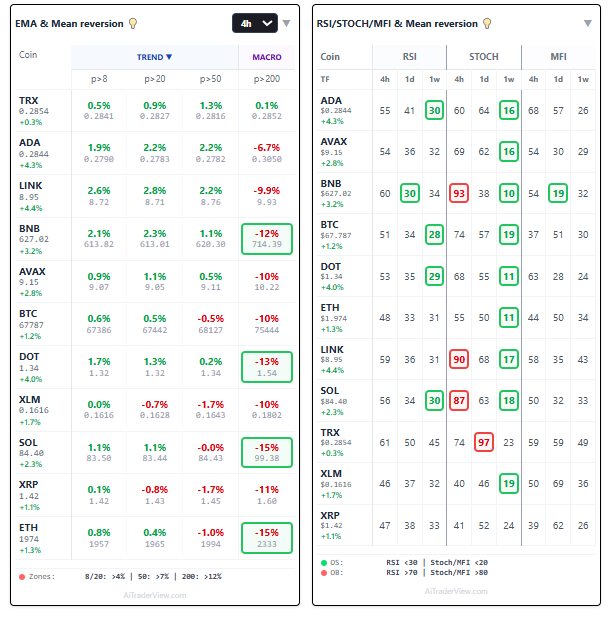
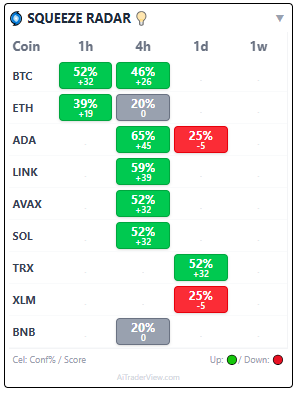
Within this system, a distinction is made between a Standard Indicator and a KPI (Key Performance Indicator).
- Standard Indicator: Calculates a single data point (e.g., Moving Average).
- KPI: Performs deep, multi-layered analysis. It aggregates insights from institutional flows, volume deltas, and market structure into a composite metric.
Core KPIs include:
- Market Quality Score (MQS): Assessing liquidity health.
- Leverage Pressure Index (LPI): Analyzing derivatives exposure.
- Derivatives Intelligence (OID & FOP): Monitoring Open Interest.
- Squeeze Radar: Detecting volatility compression.
3. 🛒 Summary Module
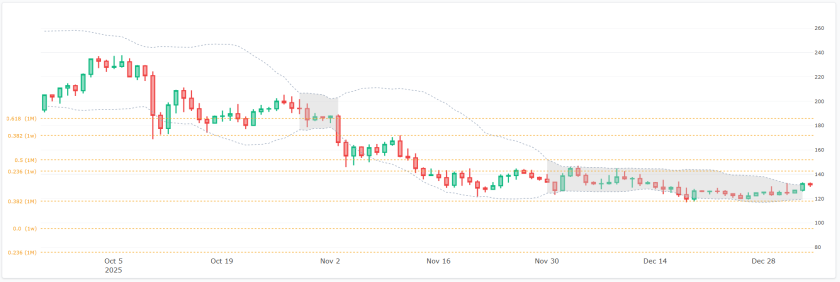
To support disciplined execution, the Summary Module offers a pre-execution audit. Before a decision is finalized, the software aggregates real-time data for the specific asset:
- Trend Alignment: Verifies the 4H or Daily trend direction.
- Volatility Status: Checks the Squeeze Radar for potential expansion.
- Structural Location: Identifies proximity to Fibonacci Golden Pockets or Resistance levels.
- Risk Assessment: Flagging potential overextended conditions.
4. ⚔️ Orderflow: Market Mechanics
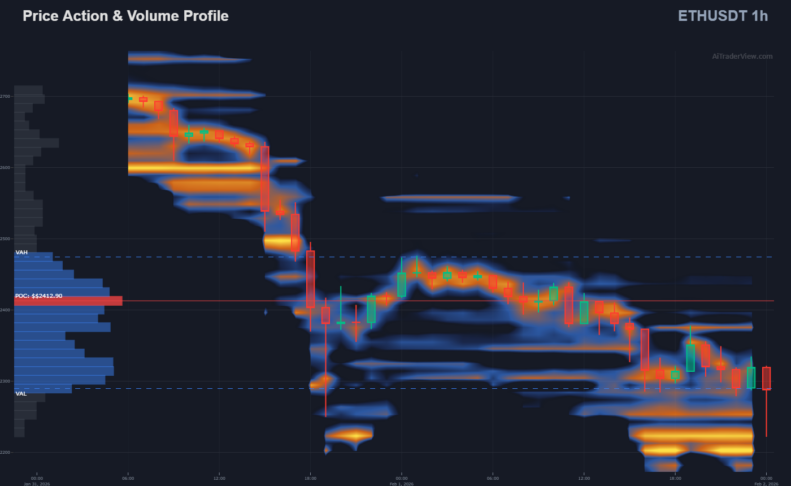
The Orderflow Module visualizes the transactional data driving price action.
- Orderbook Heatmaps: Visualizes areas of ask/bids of an Orderbook.
- Liquidation: Visualizes areas where leveraged positions may be forced to close.
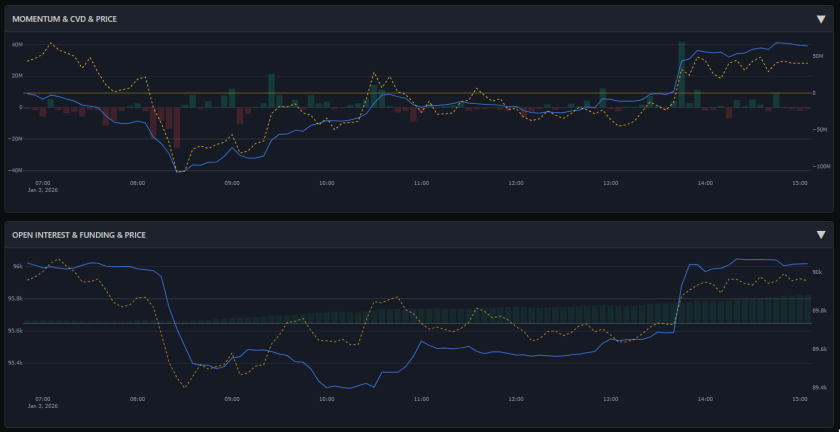
- CVD & Momentum: Tracks Cumulative Volume Delta to assess buyer/seller aggression.
- Open Interest: Monitors capital entry or exit to identify potential trend strength.
- Power Trades: Filters the order stream to highlight high-impact transactions from large market participants.
- Long/Short Account Ratios Beyond standard volume metrics, the system visualizes the ratio of Top Long versus Top Short accounts. This provides a direct look into the positioning of higher-tier traders, allowing users to gauge retail vs. institutional sentiment and identify potential squeeze scenarios.
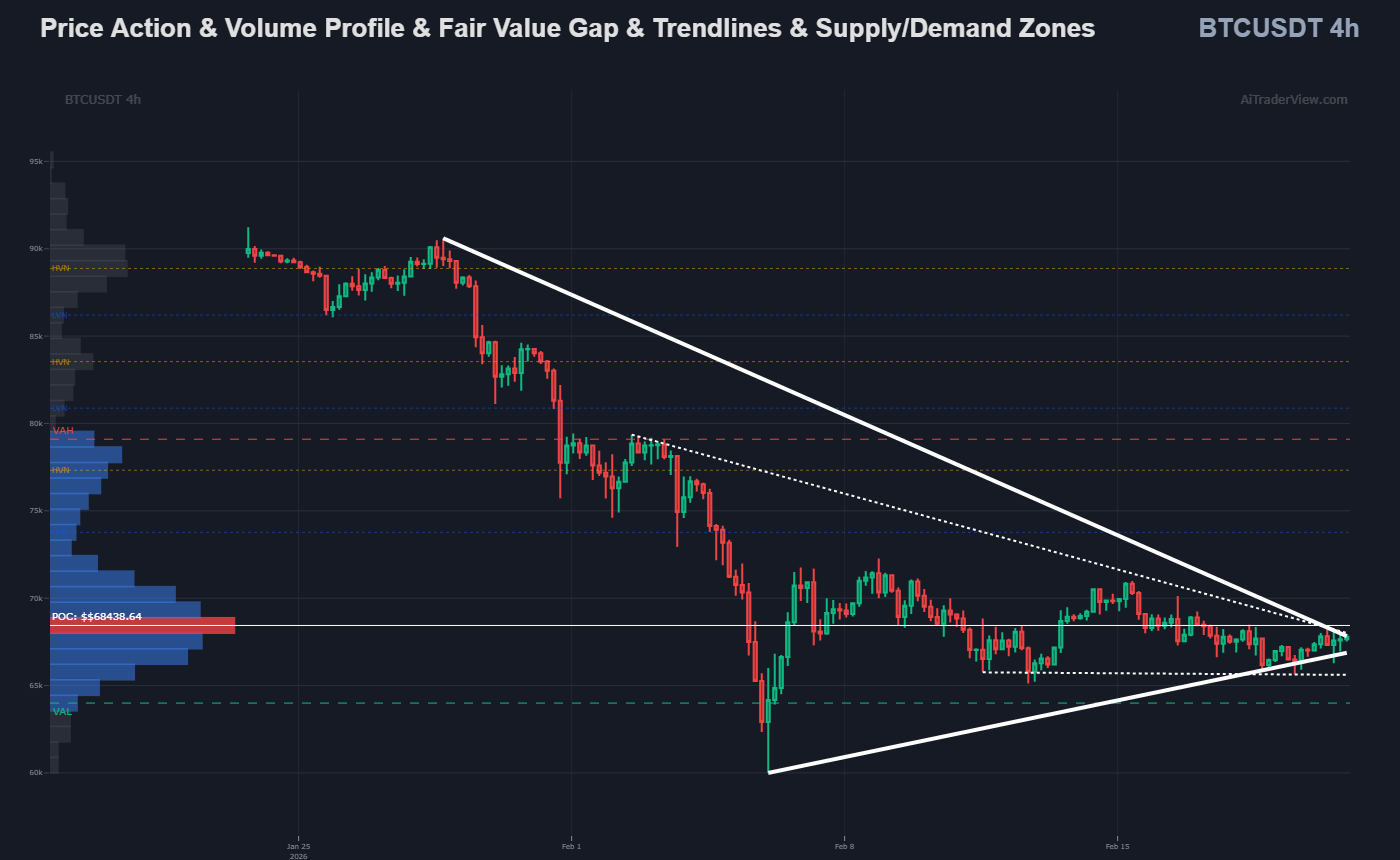
- Algorithmic Trendlines Manual trendline drawing can introduce subjective bias. The platform features an automated trendline engine that scans historical pivot points to plot the most statistically significant support and resistance trends.
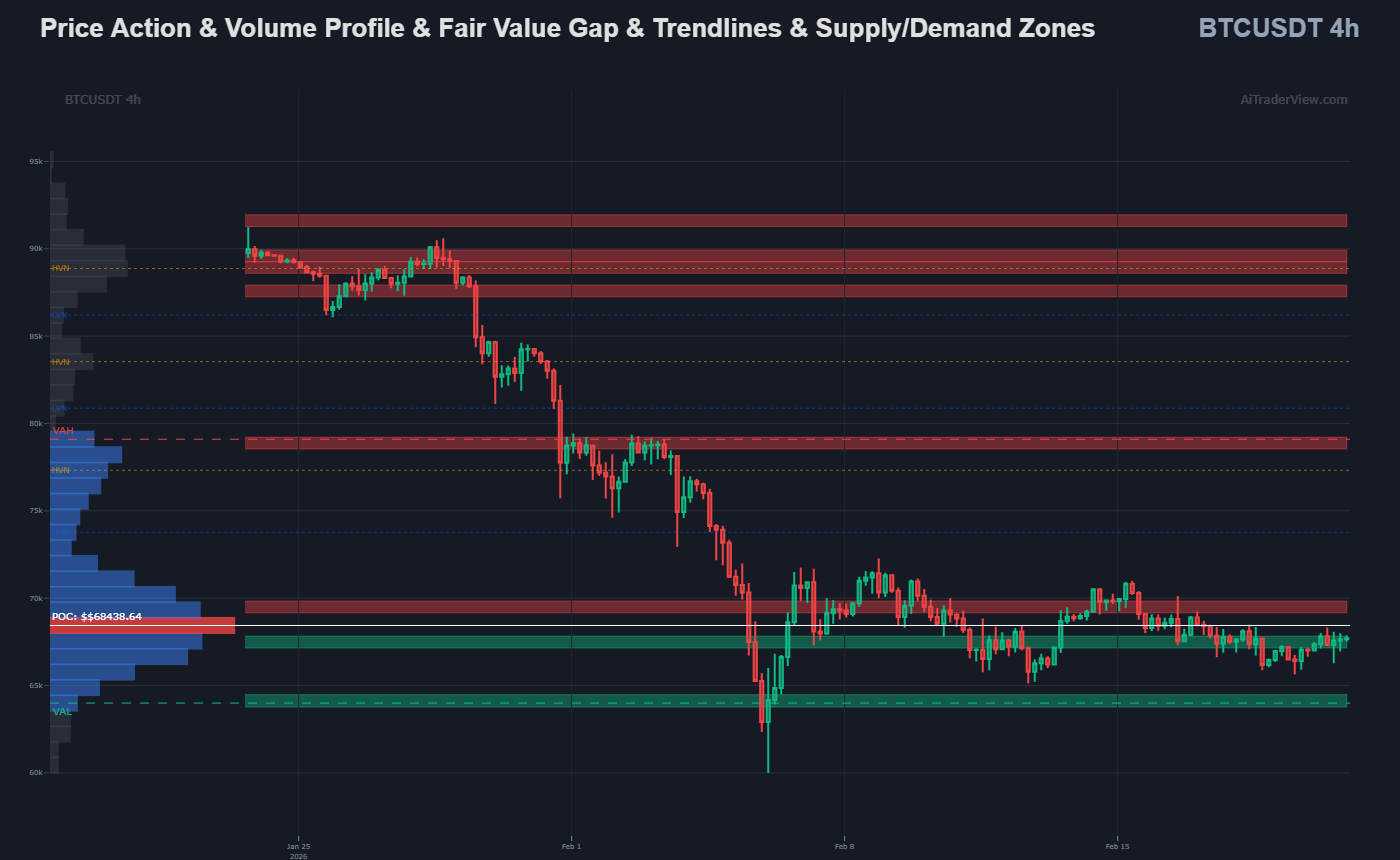
- Supply/Demand Zones To highlight historical areas of heavy buying or selling interest, the system automatically fetches and renders continuous Supply and Demand zones across the chart. These semi-transparent bands help users instantly identify potential bounce or rejection levels, functioning as visual markers for clustered limit orders.
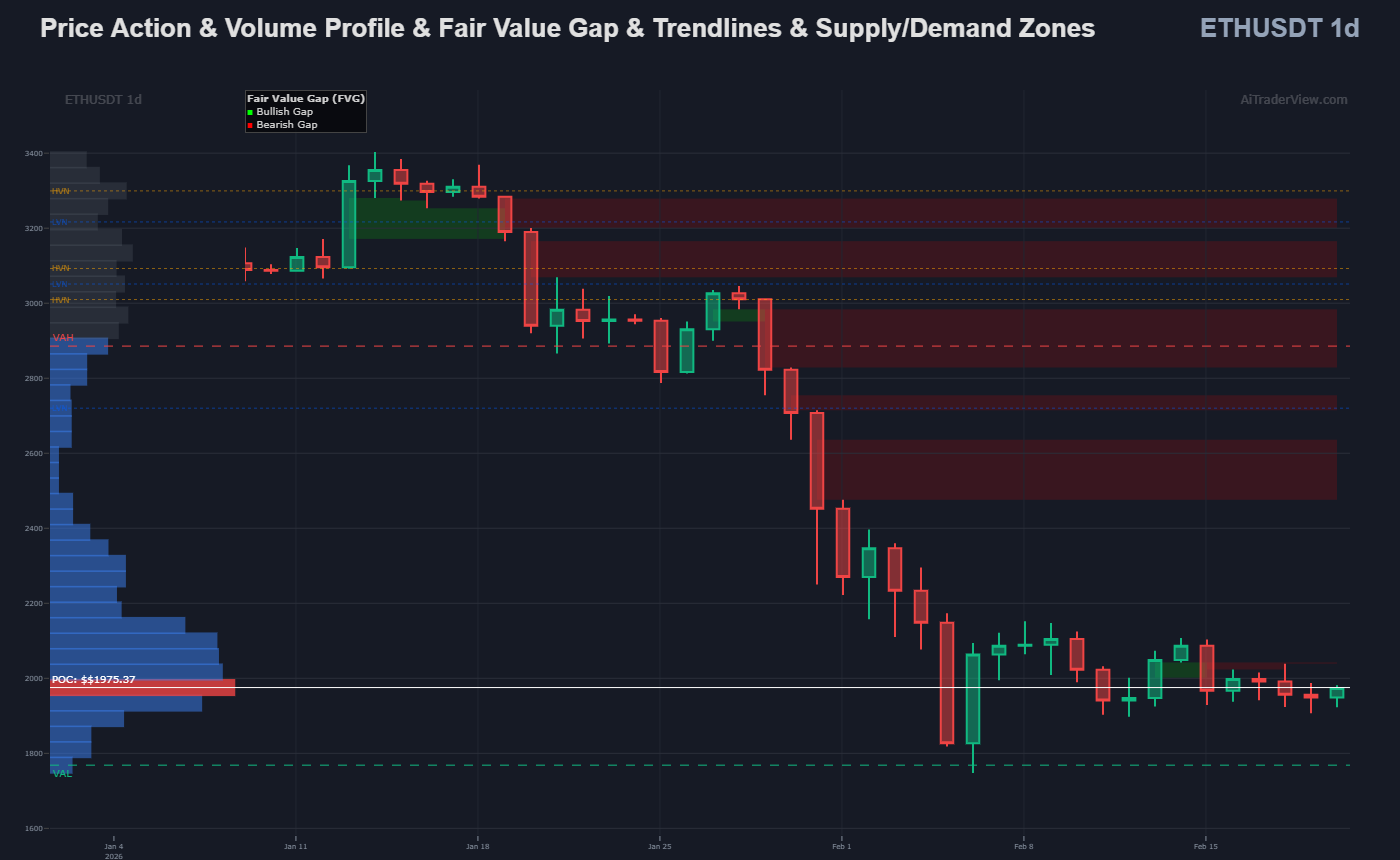
- Fair Value Gaps (FVG) The platform automatically detects and visualizes market imbalances where price moved too rapidly for efficient trading. It dynamically displays bullish (green) and bearish (red) gaps, adjusting or completely removing them in real-time as subsequent price action fills these historical liquidity voids.
5. 🔥 Heatmap: Support & Resistance
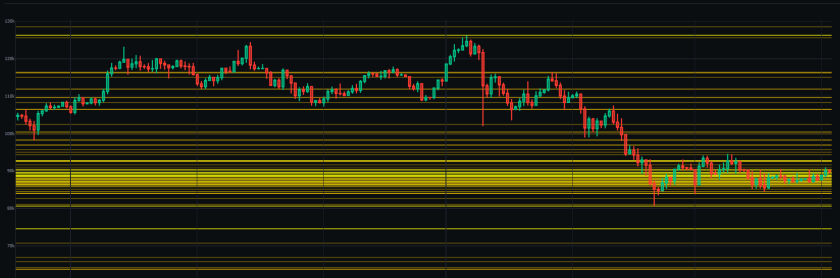
Manual plotting of levels can be subjective. The Support and Resistance Heatmap aggregates data points—such as daily pivots, Points of Control (POC), and Golden Pockets—and visualizes them as a dynamic heat zone. This helps users objectively identify areas of high technical confluence.
6. 💼 Watchlist
The Watchlist section gives you a sortable overview of the coins you follow.
- Live Overview: Prices, mini charts, AI scores and multi-timeframe performance in one table.
- Quick Analysis: Open the AI analysis, S&R Heatmap, Orderflow or Summary directly from each row.
7. 🌍 Crypto Heatmap Statistics
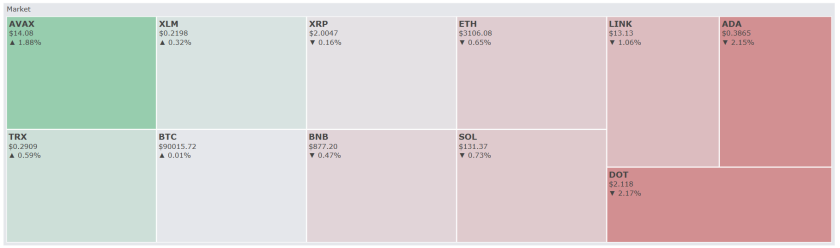
To identify market outliers efficiently, the Crypto Heatmap Statistics section filters real-time data. This allows users to view daily gainers, losers, and volatility leaders (ADX) instantly, providing a quick overview of market sentiment without scanning individual charts.
8. 🏆 Market Overview (Macro Context)
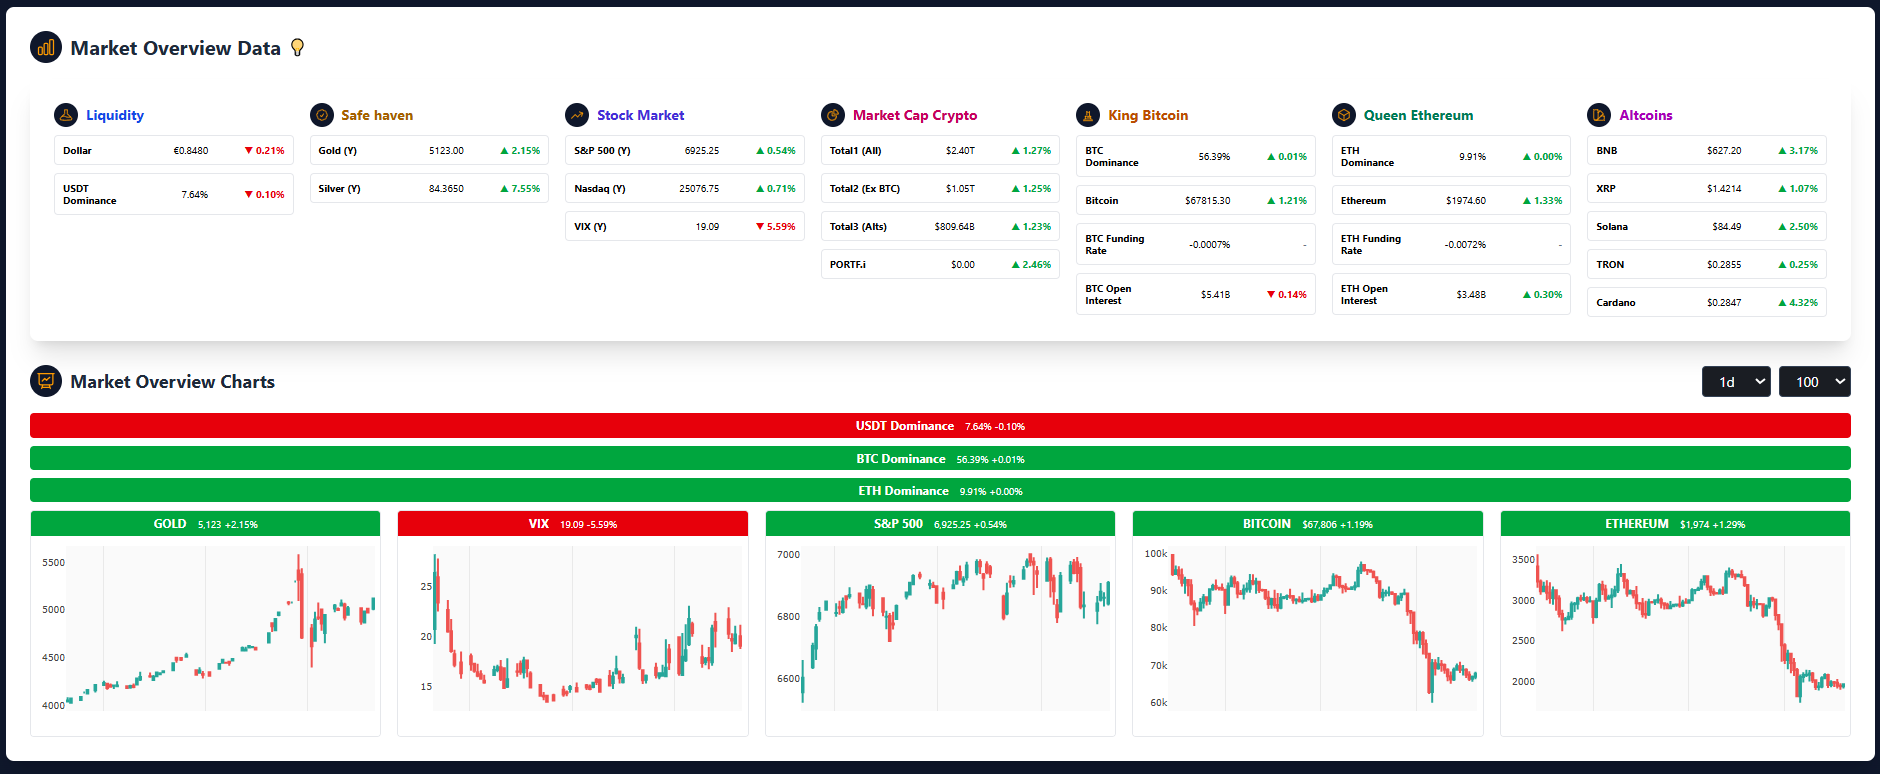
The Market Overview tab provides a “Top-Down” perspective. It combines traditional macro drivers (Equities, Dollar, Gold) with crypto-native metrics.
- Utility: Analyzing the broader economic trend helps users assess correlation risk. If global markets exhibit high volatility, individual crypto setups may carry increased risk.
9. 🤖 AI Quant Researcher
The AI Quant Researcher module synthesizes platform data into readable intelligence reports. Instead of manually cross-referencing indicators, the AI generates:
- Executive Summaries: High-level overviews for rapid assessment.
- Deep Dive Reports: Detailed analysis of market regimes and trend strength.
Key Intelligence Features:
- Moving Average & Fib Analysis: Automatically detects crossovers and reactions to key Fibonacci levels (e.g., 61.8%).
- Regime Scoring: Calculates “Regime Scores” to define the current trend environment.
- Smart S&R Mapping: Identifies critical Support (S1-S3) and Resistance (R1-R3) levels for reference.
10. Bitcoin Anomaly Detector
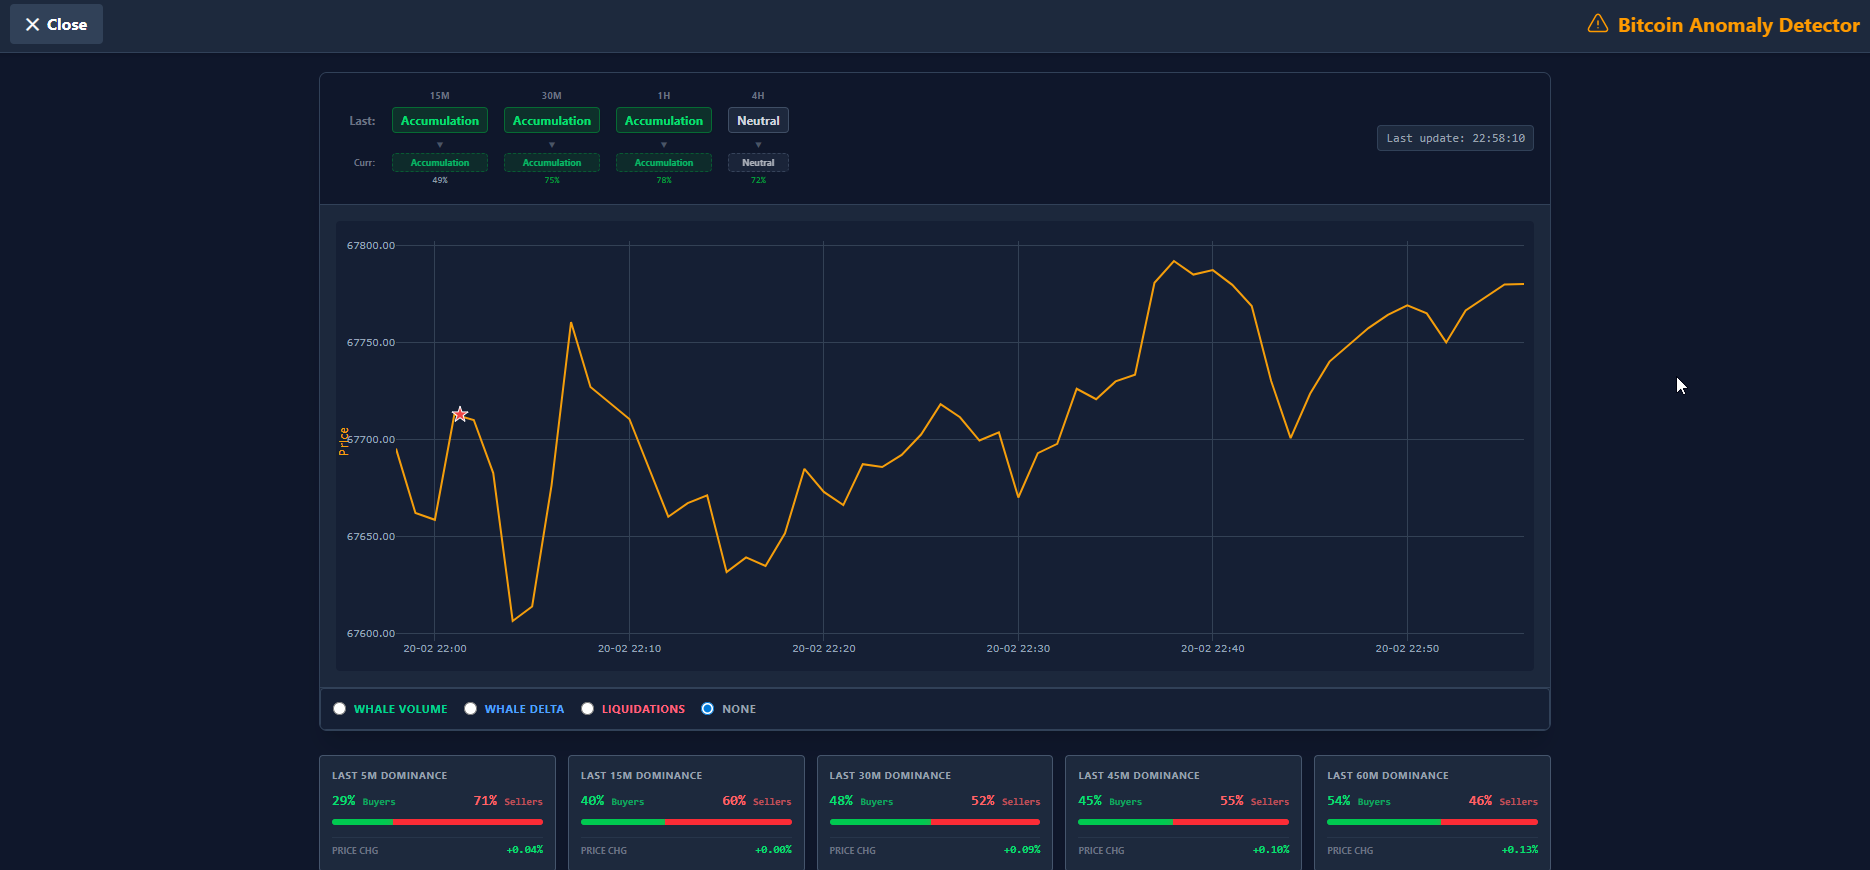
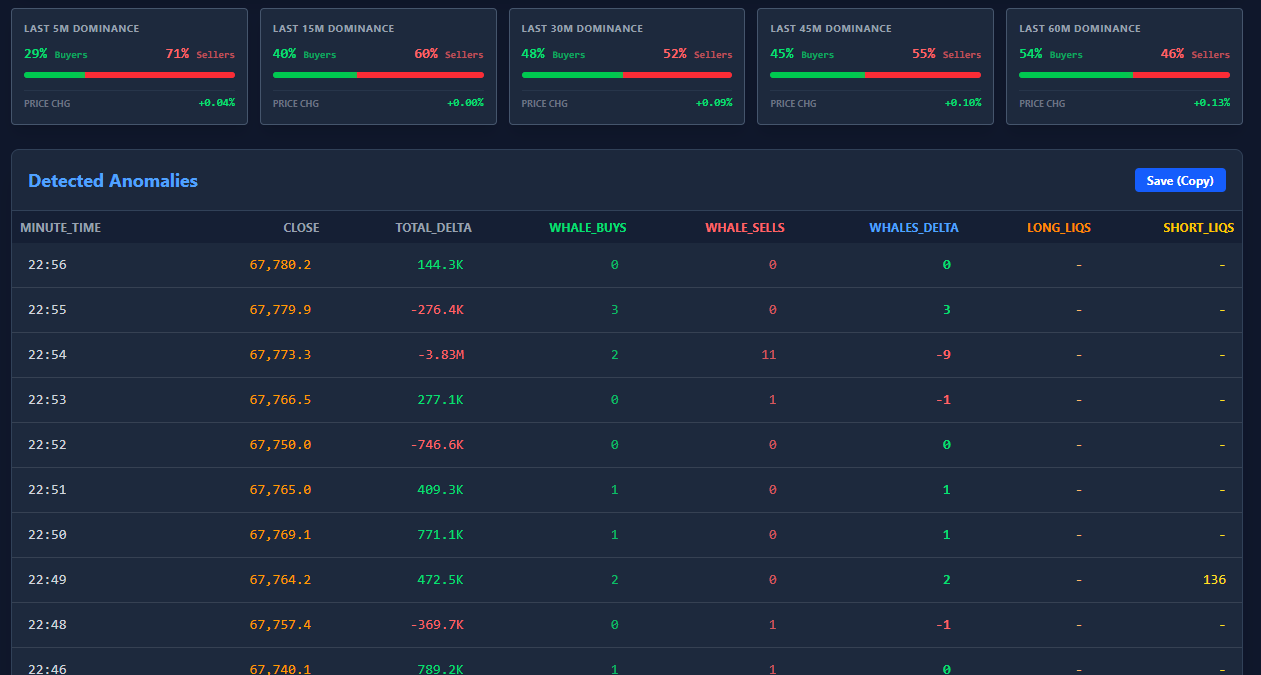
The AI Dashboard provides a real-time X-ray of the market, instantly classifying the current regime as Accumulation, Neutral, or Distribution based on order flow. It detects and visualizes hidden anomalies with star icons, signaling potential manipulation, exhaustion, or “God Candles” before they unfold. Traders can track the battle between buyers and sellers using Whale Dominance cards across 5 to 60-minute timeframes to spot smart money intent. Interactive charts allow you to overlay Whale Volume and Net Delta, revealing whether price moves are backed by genuine conviction or just retail noise. The system monitors critical liquidation levels, highlighting where long or short traders are forced out, often acting as fuel for reversals. A detailed log captures every detected anomaly and alert, which can be instantly exported to spreadsheets for deeper post-trade analysis.
Here is the concise summary:
- Real-time Market Status: Instantly identifies if the market is in Accumulation, Neutral, or Distribution phases.
- AI & System Alerts: Visualizes hidden anomalies and critical events like “God Candles” via star indicators on the chart.
- Whale Dominance: Tracks smart money intent with Buy/Sell ratios across 5 to 60-minute timeframes.
- Deep Dive Charts: Overlays Whale Volume, Delta, and Liquidations to confirm if price moves are backed by conviction.
- Actionable Data: Provides a downloadable log of every detected anomaly for further analysis.
Designed for Professional Workflows
AiTraderView — Crypto Cockpit, Crypto Portfolio, and the Advanced Analytics App together — is engineered for:
- Crypto Traders
- Analysts
- Fund Managers
- Prop Traders
- Everyday holders who simply want to track and understand their positions better
The interface prioritizes Data Confluence—the ability to view technicals, orderflow, portfolio performance, and sentiment on a single screen to inform comprehensive analysis.
Evaluation: Free Access
Crypto Cockpit and Crypto Portfolio are completely free to use, and the Advanced Analytics App is also available for FREE evaluation. This allows every trader — beginner or professional — to try the full suite of modules, including institutional data feeds (ETF flows, Liquidations, SMC), and determine which parts of the workflow fit their own process.
Conclusion: Why You Should Be Using This Today
As the crypto market evolves, the need for comprehensive data analysis increases. Whether you trade full-time or check your portfolio once a day, there is no good reason to keep working from a plain exchange chart and a spreadsheet. Crypto Cockpit gives you a professional charting workspace for free, Crypto Portfolio keeps your positions and your risk honest in one dashboard, and the Advanced Analytics App is there the moment you want to go deeper. Together they form a complete suite designed to professionalize the analytical workflow of every trader — from someone buying their first coin to a fund manager tracking dozens of positions. By basing decisions on aggregated data—from Smart Money footprints to Orderflow mechanics to your own portfolio performance—users can strive for greater consistency in their market approach.
Start with Crypto Cockpit and Crypto Portfolio today — both are free, and both are built to become the two tabs you keep open every single day.
Start our FREE AiTraderView Technical Analysis SoftwareLaunch AiTraderView App »
⚠️ RISK WARNING & AI DISCLOSURE
- This information is generated by Artificial Intelligence (AI) and complex algorithms. While advanced, these systems can contain errors or inaccuracies and are for educational purposes only.
- Technical analysis provides no guarantees; this information is purely informative.
- All discussed scenarios are hypothetical and do not constitute predictions or expectations.
- Past performance is not an indicator of future results.
- This is not financial advice and is not intended as a call-to-action for the reader.
- No implicit direction is claimed, and no specific behavior of market participants is suggested.