
The latest Crypto RSI Heatmap shows most of the 33 tracked coins oversold on the 4-hour and daily charts, while the weekly chart still sits in neutral territory. Bitcoin trades near $69,087 with an RSI of roughly 17 on the 4H, 28 on the 1D and 54 on the 1W. Ethereum, at about $1,942, reads roughly 21, 29 and 51 on the same three timeframes.
In short: short-term momentum is stretched to the downside across the market, but the higher-timeframe picture has not been washed out yet. Below we go through each timeframe, then look at what the combination can and cannot tell us.
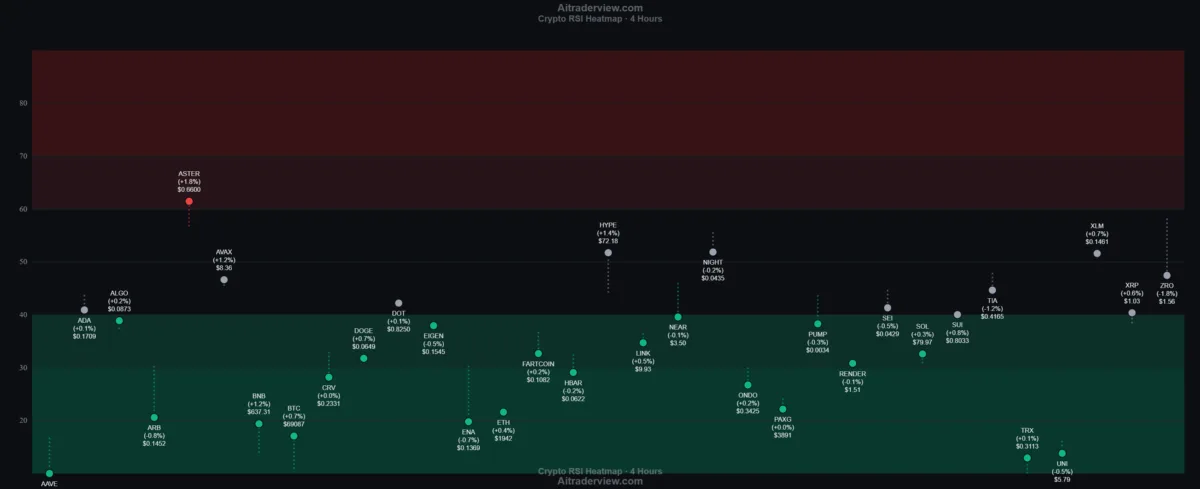
4 Hours: more than 20 of 33 coins in the green zone
On the 4-hour chart, only ASTER (RSI around 61) is in the red zone, while more than 20 coins sit at or below 40 and about a dozen are below 30.
The lowest readings come from AAVE (at the bottom of the chart, around 10 or lower), TRX (about 13), UNI (about 14), BTC (about 17), BNB (about 19), ENA and ARB (both about 20) and ETH (about 21). PAXG, ONDO, CRV and HBAR follow in the high 20s.
Not everything is washed out. HYPE, NIGHT and XLM hover around 51 to 52, ZRO and AVAX sit in the high 40s, and ADA, DOT, SEI, SUI and XRP are close to the 40 line. Price changes over the 4-hour period are small, mostly between -1% and +1%, with TIA (-1.2%) and ZRO (-1.8%) the weakest.
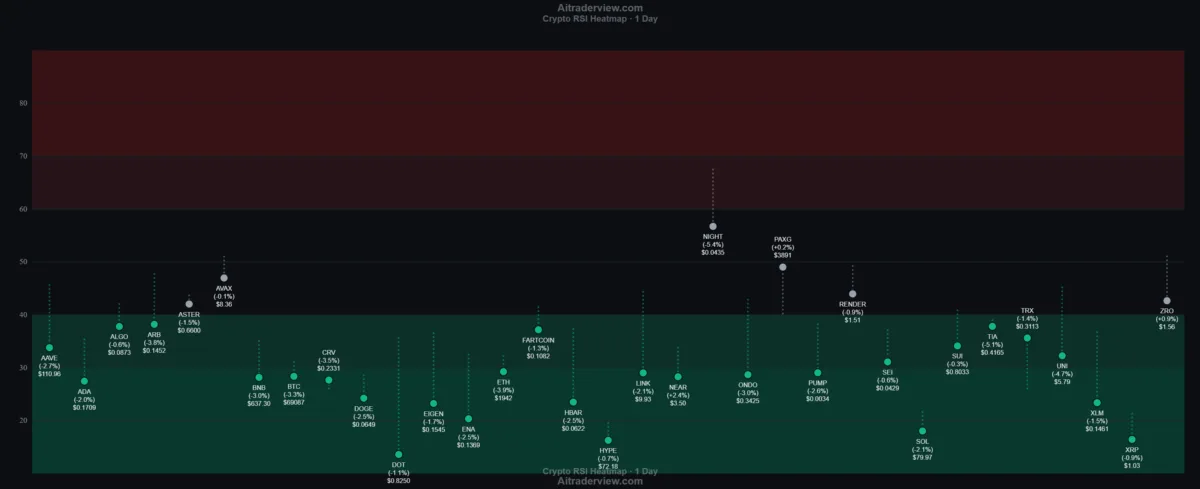
1 Day: 27 of 33 coins at or below 40, none in the red zone
The daily chart is the broadest oversold picture of the three: 27 coins sit at or below 40, roughly 18 of them below 30, and no coin reaches the red zone. The highest reading is NIGHT at about 57, followed by PAXG (about 49) and AVAX (about 47).
The deepest readings are DOT (about 14), HYPE (about 16), XRP (about 17) and SOL (about 18), followed by ENA, DOGE, EIGEN, HBAR and XLM in the low to mid 20s. Bitcoin and Ethereum are at about 28 and 29, with BNB, LINK, NEAR and ONDO in the same area.
The daily price changes explain the picture: BTC is down 3.3%, ETH 3.9%, ARB 3.8%, UNI 4.7%, TIA 5.1% and NIGHT 5.4%. Only NEAR (+2.4%), ZRO (+0.9%) and PAXG (+0.2%) are up.
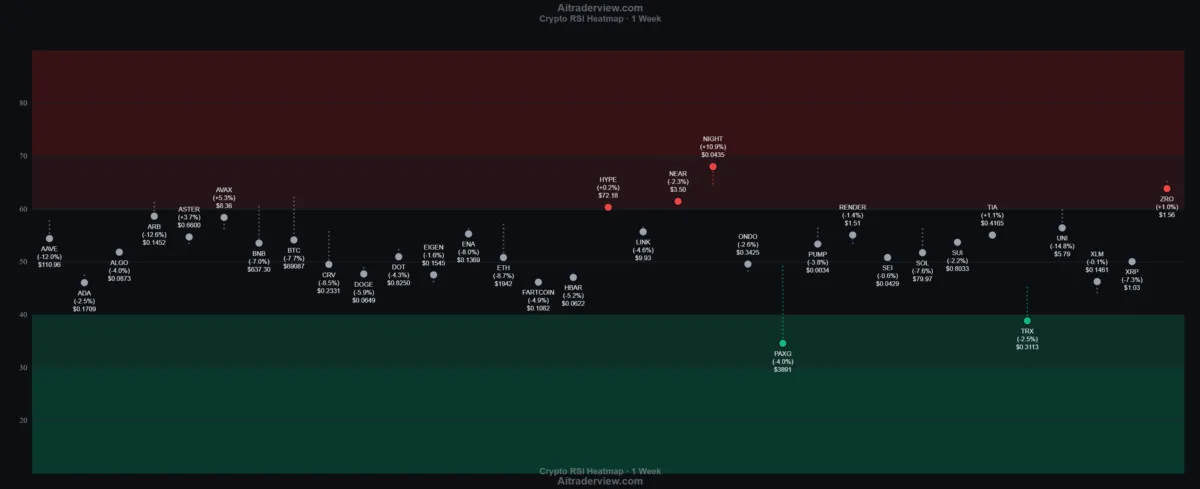
1 Week: 27 of 33 coins in the neutral band
The weekly chart looks very different: 27 coins sit between 40 and 60, four are in the red zone and two are in the green zone.
The four above 60 are NIGHT (about 68, +10.9%), ZRO (about 64, +1.0%), NEAR (about 61, -2.3%) and HYPE (about 60, +0.2%). At the other end, PAXG (about 35, -4.0%) and TRX (about 39, -2.5%) are the only coins at or below 40.
The majors are neutral: BTC sits near 54 (-7.7%), ETH near 51 (-8.7%), SOL near 52 (-7.6%) and XRP near 50 (-7.3%). Even coins with the sharpest weekly drops, UNI (-14.8%), ARB (-12.6%) and AAVE (-12.0%), still read between roughly 54 and 59.
Putting the three timeframes together
The combination points to a market under short-term pressure rather than one in full capitulation: the 4H and 1D charts are broadly oversold, but the 1W chart is still neutral for almost every coin. A weekly RSI would have to fall much further, toward the 30s, before the higher timeframe shows the same stretch.
A few coins stand apart. NIGHT is the strongest on every timeframe (about 52 on the 4H, 57 on the 1D, 68 on the 1W). PAXG is the only coin that is not weak on the 1D (+0.2%) yet is the lowest on the 1W. HYPE is split: neutral on the 4H (about 52), deeply oversold on the 1D (about 16) and in the red zone on the 1W (about 60). ASTER is the only coin in the red zone on the 4H, but reads about 42 on the 1D and 55 on the 1W.
RSI measures momentum, not direction. In a strong downtrend, oversold readings can persist for a long time, so a low RSI alone is not a reason to expect a bounce. We read the heatmap as a map of where momentum is stretched, and compare timeframes before drawing conclusions.
How to read the Crypto RSI Heatmap
Each dot is one coin, placed by its current RSI on the vertical axis. A dotted line runs from the previous RSI value to the current one, so you can see in which direction momentum moved. Dots are green at or below 40, red at or above 60 and grey in between. The shaded bands mark the same zones: light and dark green below 40 and 30, light and dark red above 60 and 70.
Under each dot you see the coin name, the price change over the selected timeframe in brackets, and the current price. Use the timeframe selector to switch between 4 Hours, 1 Day, 1 Week and 1 Month.
This article is for information only and is not financial advice. Data snapshot taken on November 13, 2026; RSI values are read from the heatmap and rounded.
This article is the personal opinion of the author and is not financial advice. Trading carries risk. Written in the language of the author.