
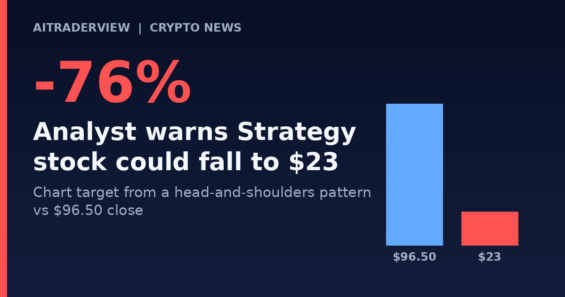
Chart analyst Aksel Kibar warned on November 18 that Strategy (MSTR) shares could fall to $23, about 76 percent below Tuesday’s close of $96.50. Kibar, a Chartered Market Technician who has followed bitcoin since at least 2018, based the call on a head-and-shoulders top on the stock’s daily chart, as reported by CoinDesk.
According to Kibar, shares dipped below the neckline of roughly $101 in the third quarter and rebounded, but the bounce failed to clear the high of the right shoulder. That leaves the pattern intact in his view. The $23 target comes from measuring the distance between the head and the neckline and projecting it downward from the breakdown point.
Kibar also linked the outlook to bitcoin, which Strategy’s shares tend to follow. He sees bitcoin trading in a range between $60,000 and $82,800, and says a break out of that range could resume the downtrend. Bitcoin was near $64,800 when CoinDesk wrote the story.
MSTR has lost more than half of its value over the past year. Strategy holds 850,849 BTC, worth about $55 billion at the time of writing, according to the CoinDesk report. Some observers also say that MSCI’s decision to remove the stock from its equity indexes could make it harder for the company to raise money for bitcoin purchases.
This is a technical projection from one analyst, not a forecast from Strategy, and chart targets often fail.
Track the market yourself with AiTraderView’s FREE tools: Crypto Cockpit for charts and 75+ indicators, Crypto Screener to find setups, and Crypto Portfolio to follow your holdings. Just create a FREE account and try them yourself!
Sources:
⚠️ RISK WARNING & AI DISCLOSURE
- This information is generated by Artificial Intelligence (AI) and complex algorithms. While advanced, these systems can contain errors or inaccuracies and are for educational purposes only.
- Technical analysis provides no guarantees; this information is purely informative.
- All discussed scenarios are hypothetical and do not constitute predictions or expectations.
- Past performance is not an indicator of future results.
- This is not financial advice and is not intended as a call-to-action for the reader.
- No implicit direction is claimed, and no specific behavior of market participants is suggested.