
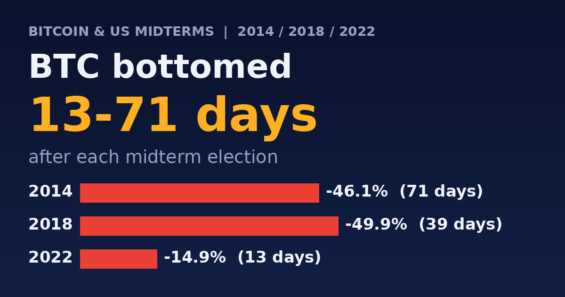
3 नवंबर को होने वाले US मिडटर्म चुनावों के साथ, एक लोकप्रिय दावा कहता है कि bitcoin आमतौर पर इनके ठीक बाद तली बनाता है। StatMuse के दैनिक क्लोज़ दिखाते हैं कि यह पिछले तीन साइकिल में सही रहा, लेकिन पहले और बड़ी गिरावट आई।
| चुनाव | चुनाव के दिन का क्लोज़ | उसके बाद का सबसे निचला क्लोज़ | गिरावट | कितने दिन बाद |
|---|---|---|---|---|
| 4 नवंबर 2014 | $330.49 | $178.10 (14 जनवरी 2015) | -46.1% | 71 |
| 6 नवंबर 2018 | $6,461.01 | $3,236.76 (15 दिसंबर 2018) | -49.9% | 39 |
| 8 नवंबर 2022 | $18,541.27 | $15,787.28 (21 नवंबर 2022) | -14.9% | 13 |
इनमें से हर निचला स्तर उस साइकिल की तली भी था। मिडटर्म वाले साल खुद कमज़ोर रहे: Binance Research के अनुसार कैलेंडर वर्ष की गिरावट 2014 में 56%, 2018 में 73% और 2022 में 64% रही। 24/7 Wall St. में बताए गए Binance Research के अनुसार, मिडटर्म के बाद के साल में bitcoin औसतन 54% बढ़ा, जो तीन साइकिल पर आधारित है। क्लोज़ की मेरी अपनी जांच चुनाव के दिन से मापने पर 2018 से 2019 के लिए +44.9% और 2022 से 2023 के लिए +92.3% देती है।
नमूना बहुत छोटा है और संदर्भ अलग थे: 2014 और 2018 लंबे बेयर मार्केट थे, जबकि 2022 का निचला स्तर FTX के पतन के दौरान आया। यहां कुछ भी पूर्वानुमान नहीं है।
Bitcoin लगभग $77,000 के पास कारोबार कर रहा है, जो अक्टूबर 2025 के लगभग $126,000 के उच्चतम स्तर से करीब 39% नीचे है, और यह 1 जुलाई को पहले ही $57,718 तक गिर चुका है। $77,000 पर यांत्रिक रूप से लागू करने पर 15% और 50% की गिरावट का मतलब लगभग $65,600 और $38,600 होगा, लेकिन जुलाई का निचला स्तर पहले ही सबसे नरम स्थिति से नीचे है।
AiTraderView के मुफ़्त टूल से खुद बाज़ार पर नज़र रखें: चार्ट और 75+ इंडिकेटर के लिए Crypto Cockpit, सेटअप खोजने के लिए Crypto Screener और अपनी होल्डिंग्स ट्रैक करने के लिए Crypto Portfolio। बस एक मुफ़्त अकाउंट बनाएँ और खुद आज़माएँ!
स्रोत:
- StatMuse: Bitcoin price on November 4, 2014
- StatMuse: Bitcoin closing prices, January 2015
- StatMuse: Bitcoin closing prices, November 2018
- StatMuse: Bitcoin closing prices, December 2018
- StatMuse: Bitcoin closing prices, November 2022
- 24/7 Wall St.: Bitcoin Fell in Every Past Midterm Year and Rallied the Year After
⚠️ RISK WARNING & AI DISCLOSURE
- This information is generated by Artificial Intelligence (AI) and complex algorithms. While advanced, these systems can contain errors or inaccuracies and are for educational purposes only.
- Technical analysis provides no guarantees; this information is purely informative.
- All discussed scenarios are hypothetical and do not constitute predictions or expectations.
- Past performance is not an indicator of future results.
- This is not financial advice and is not intended as a call-to-action for the reader.
- No implicit direction is claimed, and no specific behavior of market participants is suggested.