Volume Profile: The ‘X-Ray’ Vision for Market Analysis
When investors first begin analyzing charts, the primary focus is usually on price action: is the asset moving up or down? Many also utilize the standard volume bars found at the bottom of the chart, which indicate how much was traded during a specific time frame.
However, standard volume data leaves a critical question unanswered: at what price did the most activity occur?
This is where the Volume Profile becomes essential. It is a widely used technical analysis tool that, unlike standard volume indicators, provides a horizontal view of market activity. It acts as an “X-ray” for the chart, revealing the underlying structure of market interest and liquidity.
Time vs. Price: A Different Perspective
Most charts display volume per unit of time (e.g., volume per hour or day). This is represented by vertical bars at the bottom of the screen. Volume Profile rotates this perspective 90 degrees, displaying horizontal bars on the side of the chart (typically the right side).
It does not answer the question: “How much was traded at 10:00 AM?” Instead, it answers: “How much was traded at the price of $50?”
This distinction is vital for understanding market depth. Institutional market participants often focus on value rather than time, executing orders when prices reach specific liquidity zones. Volume Profile visualizes exactly where these participants have been most active.
The Anatomy of the Volume Profile
When the Volume Profile is applied to a chart, it resembles a histogram or a mountain range on the vertical axis. To interpret this data correctly, it is necessary to understand the following key components:
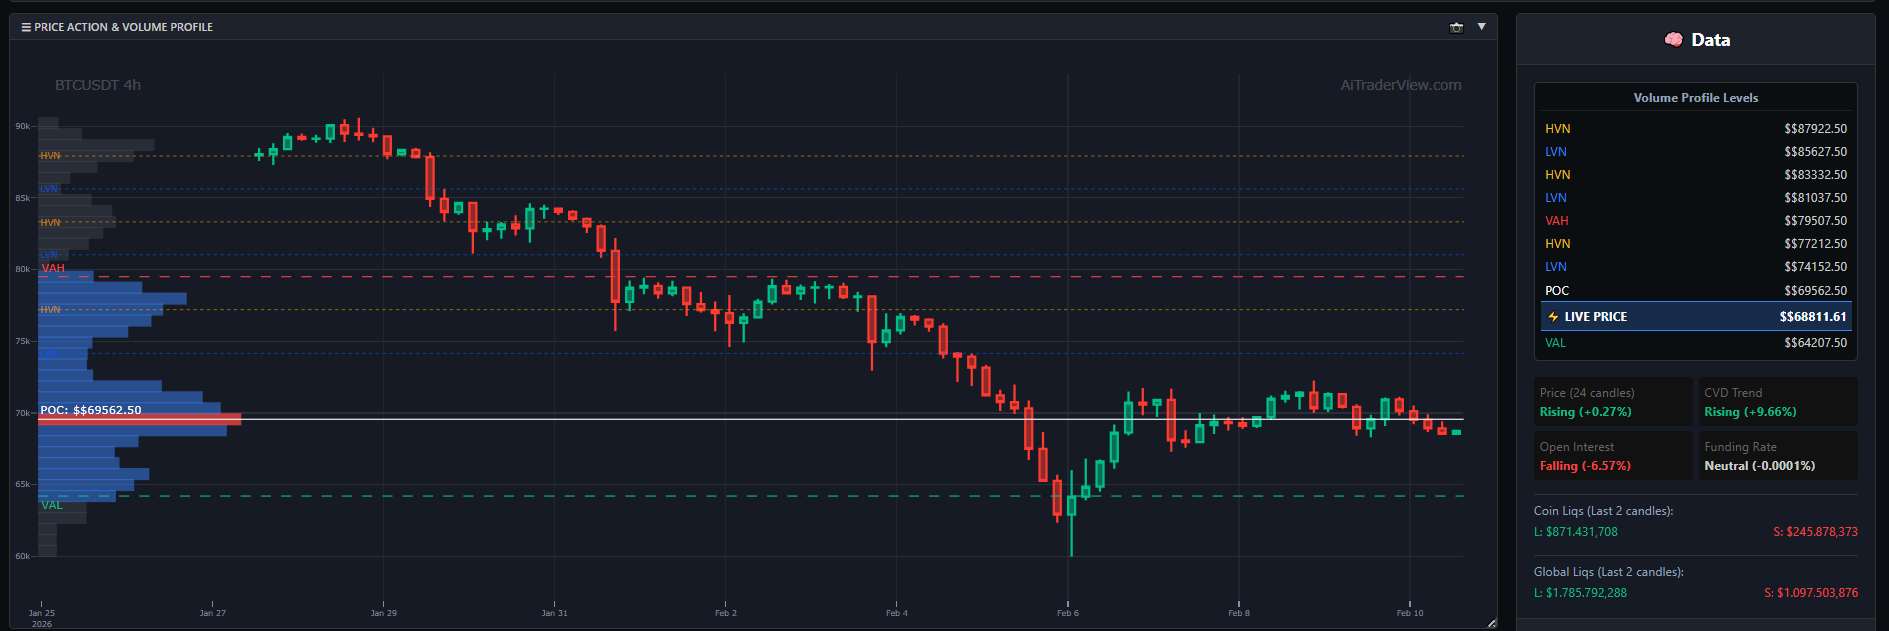
1. Point of Control (POC)
The Point of Control is the single most significant level on the profile. It represents the price level where the highest volume was traded within the selected period. In technical analysis, the POC is often viewed as the price most accepted by the market at that time. It can act as a magnet; if the price drifts away, it often has a tendency to revert to this high-liquidity area.
2. Value Area (VA)
Surrounding the POC is a specific zone, usually highlighted in a different color, known as the Value Area. This zone represents where approximately 70% of the total trading volume occurred.
- VAH (Value Area High): The upper boundary of the Value Area.
- VAL (Value Area Low): The lower boundary of the Value Area. When the price is within this area, the market is considered to be in a state of balance.
3. HVN and LVN (Liquidity Zones)
The profile is rarely a smooth curve; it contains peaks and valleys.
- High Volume Nodes (HVN): These are the peaks in the profile, indicating high activity. Prices often move slowly through these zones because there is significant liquidity and interest from both buyers and sellers.
- Low Volume Nodes (LVN): These are the valleys or “thin” sections of the profile. Little trading occurred at these levels. Prices often move rapidly through LVNs due to a lack of liquidity or resistance.
Interpreting Profile Shapes
The overall shape of the Volume Profile can provide insight into market context and sentiment. Analysts often categorize these shapes by the letters they resemble:
- D-Shape (Balanced): The profile resembles the letter D, with the majority of volume centered in the middle. This indicates a balanced market where buyers and sellers agree on the current value range.
- P-Shape (Uptrend/Short Covering): The profile resembles a P, with high volume at the top and a thin stem below. This pattern is often observed during an uptrend or a short squeeze, where a consolidation occurs at higher prices.
- b-Shape (Downtrend/Long Liquidation): The profile resembles a lowercase b, with high volume at the bottom and a thin stem above. This is frequently seen during downtrends or periods of long liquidation, indicating value is being established at lower prices.
Practical Applications in Technical Analysis
Traders utilize Volume Profile for several analytical purposes:
- Identifying Support and Resistance: unlike drawing a simple horizontal line at a previous high or low, a High Volume Node (HVN) represents a price level with proven historical interest. These levels often act as significant support or resistance zones.
- Gauging Volatility Potential: Identifying Low Volume Nodes (LVNs) helps analysts understand where price might accelerate. Because there is little historical “friction” (trading history) in these zones, volatility tends to increase as the price moves through them.
- Contextualizing Breakouts: If a price breaks out of a range but does so on low volume, the Volume Profile may suggest a lack of market acceptance, increasing the probability of the price returning to the Value Area.
Conclusion
Volume Profile is not a predictive tool that guarantees future price movements. Instead, it is a contextual tool that explains why the price moved a certain way in the past. It shifts the focus from time to price, providing a clearer view of where the market finds value.
By understanding the Value Area and the Point of Control, market participants can better analyze market structure, identify liquidity constraints, and interpret price action with greater clarity.
⚠️ RISK WARNING & AI DISCLOSURE
- This information is generated by Artificial Intelligence (AI) and complex algorithms. While advanced, these systems can contain errors or inaccuracies and are for educational purposes only.
- Technical analysis provides no guarantees; this information is purely informative.
- All discussed scenarios are hypothetical and do not constitute predictions or expectations.
- Past performance is not an indicator of future results.
- This is not financial advice and is not intended as a call-to-action for the reader.
- No implicit direction is claimed, and no specific behavior of market participants is suggested.