KPI: VWAP MULTI-TF
Institutional Benchmarking: VWAP Multi-TF Analysis
The VWAP Multi-TF Analysis is a technical KPI within the intelligence suite designed to analyze Volume Weighted Average Price (VWAP). In professional trading, VWAP is widely utilized as a benchmark for execution quality and fair value.
Our system expands on the standard VWAP calculation by simultaneously monitoring and correlating three distinct anchor points: Daily (DVWAP), Weekly (WVWAP), and Monthly (MVWAP). By analyzing the interaction between price and these time-weighted averages, the system assists in identifying trend alignment and potential technical support or resistance levels.
1. Core Components: The Three Anchors
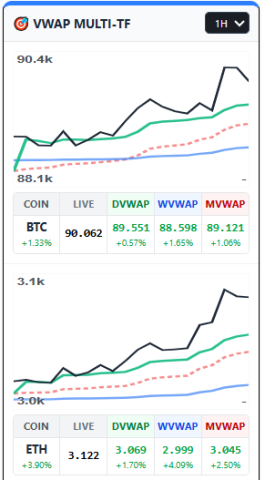
The engine monitors price action relative to three specific benchmarks:
- DVWAP (Daily): The volume-weighted average price since the start of the current trading day (00:00 UTC). Technical analysts often use this as a reference for intraday momentum.
- WVWAP (Weekly): The average price since the start of the current week. This level is often used to define the medium-term trend direction.
- MVWAP (Monthly): The average price since the start of the current month. This represents the broader trend often monitored by larger market participants.
2. Dashboard Features
The VWAP Multi-TF dashboard provides visual data aggregation:
- Integrated Charts: A real-time visualization overlaying Price, MVWAP, WVWAP, and DVWAP trends across 1h, 4h, and 1d timeframes.
- Peer Analysis: Allows users to compare how other tracked assets are performing relative to their respective VWAP anchors.
- Utility: This comparison helps analysts determine if a price movement is idiosyncratic (isolated to one asset) or part of a broader sector rotation where multiple assets reclaim their VWAP levels simultaneously.
⚠️ RISK WARNING & AI DISCLOSURE
- This information is generated by Artificial Intelligence (AI) and complex algorithms. While advanced, these systems can contain errors or inaccuracies and are for educational purposes only.
- Technical analysis provides no guarantees; this information is purely informative.
- All discussed scenarios are hypothetical and do not constitute predictions or expectations.
- Past performance is not an indicator of future results.
- This is not financial advice and is not intended as a call-to-action for the reader.
- No implicit direction is claimed, and no specific behavior of market participants is suggested.