Auto Technical Analysis: 15 Amazing Tools to Scale Your Analysis Skills
Integrated Market Intelligence: The Auto Technical Analysis Suite
In cryptocurrency markets, efficient data processing is critical for decision-making. To maintain a clear market perspective, analysts often require more than simple charting; they benefit from a comprehensive Auto Technical Analysis suite that aggregates complex data into actionable insights.
Our dashboard functions as a central information hub, designed for users who prioritize analytical accuracy and workflow efficiency. Whether tracking Smart Money Concepts (SMC), Automated Support & Resistance, or ETF Flows, this system provides a unified interface to analyze market regimes and technical structure.
15 Modules for Professional Analysis
The Auto Technical Analysis interface is divided into specialized modules. Each tab serves a specific function in technical strategy. Below is a breakdown of the available data:
S&R (Support & Resistance)
- Function: Automates the calculation of significant horizontal levels based on historical pivots.
- Utility: Calculates the percentage distance of the live price from major support or resistance zones. This assists users in defining technical invalidation points or potential targets.
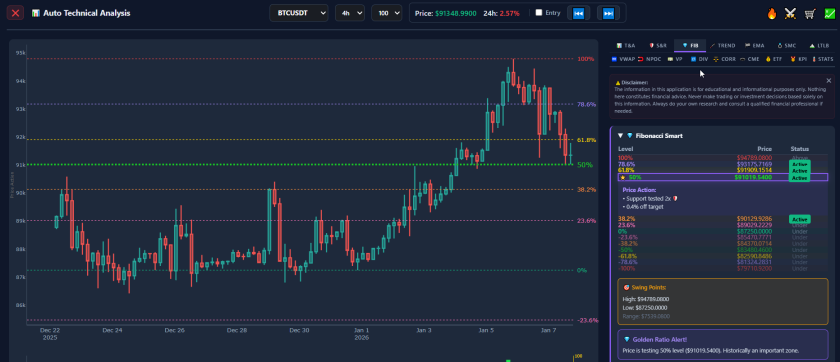
FIB (Fibonacci Smart)
- Function: Automatically detects significant swing highs and lows to overlay standard retracement levels (e.g., 0.618).
- Utility: The system highlights when price is interacting with a Fibonacci zone, identifying areas of interest often used for retracement analysis.
TREND (Trend Structure)
- Function: Uses pivot point algorithms to identify Higher Highs (HH) and Higher Lows (HL).
- Utility: Visually maps market structure to categorize the asset’s state: Uptrend, Downtrend, or Consolidation.
EMA (Exponential Moving Averages)
- Function: Tracks momentum across five key timeframes (EMA 8, 20, 50, 100, 200).
- Utility: Provides the “slope” calculation for each EMA, offering insight into the velocity and directional bias of the trend.
SMC (Smart Money Concepts)
- Function: Tracks structural elements such as BoS (Break of Structure) and CHoCH (Change of Character).
- Utility: Highlights open Fair Value Gaps (FVG), marking price ranges where inefficiencies exist that technical theory suggests may be revisited.
LTLB (Last Top / Last Bottom)
- Function: Calculates the distance to the most recent local swing high and swing low.
- Utility: Provides an instant calculation of the trading range, assisting in the assessment of Risk/Reward (R/R) ratios relative to current volatility boundaries.
VWAP (Volume Weighted Average Price)
- Function: Displays Multi-Timeframe VWAP levels (Daily, Weekly, Monthly).
- Utility: Identifies high-confluence areas where price action aligns with the volume-weighted average of different time horizons.
NPOC (Naked Point of Control)
- Function: Tracks Naked POCs—volume nodes from previous sessions that have not yet been retested.
- Utility: In Auction Market Theory, these unvisited levels are often monitored as potential targets for mean reversion strategies.
VP (Volume Profile)
- Function: Visualizes the “Value Area,” including the POC (Point of Control), VAH (Value Area High), and VAL (Value Area Low).
- Utility: Differentiates between High Volume Nodes (consensus zones) and Low Volume Nodes (areas of low liquidity/rapid movement).
DIV (Divergence Matrix)
- Function: Scans RSI, Stochastic, MACD, Volume, and OBV for potential divergences.
- Utility: Alerts users when price action contradicts momentum indicators (e.g., Price rising while RSI falls), often interpreted as a sign of waning momentum.
⚖️ CORR (BTC Correlation & Lag)
- Function: Analyzes the Beta and Pearson Correlation of an asset relative to Bitcoin.
- Utility: Identifies “Lag Signals”—statistical instances where an asset’s price movement is delayed compared to the market leader.
🕳️ CME (Bitcoin Futures Gaps)
- Function: Monitors price gaps created over the weekend on the CME Bitcoin futures market.
- Utility: Tracks these levels as potential technical objectives, based on the historical tendency for futures gaps to close.
ETF (Institutional Flows)
- Function: Displays real-time net flow data for BTC, ETH, and SOL ETFs.
- Utility: Provides data on institutional accumulation or distribution trends, visualizing net capital movement.
KPI (Key Performance Indicators)
- Function: Aggregates macro data such as the VIX (Volatility Index), Stablecoin Pressure Index (SPI), and Leverage Pressure Index (LPI).
- Utility: Determines the overall market regime (e.g., Risk-On vs. Risk-Off).
STATS (Candlestick & OHLCV)
- Function: Provides raw OHLCV data and automated recognition for 20+ Candlestick Patterns.
- Utility: Streamlines the identification of standard technical patterns (e.g., Engulfing, Morning Star) for data-driven confirmation.
Why Use Auto Technical Analysis?
In active markets, manual charting is time-intensive. The Auto Technical Analysis system automates the calculation process, allowing users to focus on strategy execution and risk management. By combining on-chain data (like ETF flows) with mathematical precision (like EMA slopes), users gain a comprehensive view of market structure.
⚠️ RISK WARNING & AI DISCLOSURE
- This information is generated by Artificial Intelligence (AI) and complex algorithms. While advanced, these systems can contain errors or inaccuracies and are for educational purposes only.
- Technical analysis provides no guarantees; this information is purely informative.
- All discussed scenarios are hypothetical and do not constitute predictions or expectations.
- Past performance is not an indicator of future results.
- This is not financial advice and is not intended as a call-to-action for the reader.
- No implicit direction is claimed, and no specific behavior of market participants is suggested.