

The crypto market in mid‑June 2026 is in a highly interesting but tense phase. Ethereum (ETHUSDT) is trading around a live price of $1,758.87 and shows across multiple timeframes a complex mix of short‑term recovery attempts and persistent long‑term selling pressure. This detailed market overview examines macroeconomic indicators, on‑chain statistics, orderflow data and technical charts to clarify where the second‑largest cryptocurrency may be headed.
The Macro‑economic Climate: A Defensive Stance
To understand Ethereum’s current price action, we first look at the broader economic picture. The data show the crypto market is currently highly correlated with traditional markets; the Crypto‑Equity Correlation scores 1.00, meaning crypto moves almost in sync with the Nasdaq 100 (down -0.24%, at 30,392.5) and the S&P 500 (down -0.43%, at 7,573.0).
Macro indicators point to a defensive mood. The US Dollar Index (DXY) rose slightly +0.17% to 99.70, while Gold climbed +0.31% to a record 4,364.900. The VIX increased +2.68% to 16.85, signaling moderate volatility (Level 3) and pushing traders toward a defensive stance. This aligns with a rise in USDT Dominance (+0.08% to 8.05%), indicating rotation into stablecoins—a historically bearish sign. Total crypto market capitalization fell -0.97% to $2.315T, with Total 2 (ex‑BTC) at $1.009T and Total 3 (altcoins ex‑BTC/ETH) at $797.20B.
Bitcoin (BTC) is down -0.56% to $65,303.99 with dominance 56.40%. BTC funding rate is negative (-7.32% APR), suggesting short pressure, while Open Interest (OI) slipped -0.40% to $6.64B. Ethereum fell -1.76% in 24 hours to $1,761.53 (dominance 9.16%). Notably, ETH funding remains positive at +2.56% APR, even as ETH Open Interest dropped -0.35% to $3.92B.
Short‑Term Analysis (4‑Hour Timeframe) and Orderflow
On the 4‑hour (4H) timeframe the market is attempting to maintain an uptrend (Higher Highs and Higher Lows) but faces heavy pressure. The most recent candle (T‑1) opened at $1,785.09, reached a high of $1,786.15, a low of $1,759.35, and closed at $1,763.92, with volume 35,118 units. No clear wick or squeeze was detected, but Squeeze Momentum reads -3.5146 with the label Strong Down.
Other 4H indicators show a mixed picture:
- RSI: 53.97 (neutral after a drop of -5.69).
- ADX & Trend Strength: ADX 31.83, +DI 28.79 above -DI 17.01.
- ATR: 31.9322.
- MACD: MACD line 26.8130 below signal 29.5590, histogram -2.7461.
- Stochastic: Stoch K 37.67, Stoch D 53.88, both falling.
- Supertrend: Still a buy signal (🟢 Up) with support at $1,733.88.
- Bollinger Bands: Price near median $1,756.78; upper $1,863.08, lower $1,650.48; bandwidth 0.12% (very tight).
- OBV: -2,986,697.078.
- VWAP: $1,788.13.
- CMF & MFI: CMF 0.1439 (bullish); MFI 63.01.
- CCI: 20.85 (neutral).
- Massi index: 25.92.
- Choppiness Index (CHOP): 43.77 (reasonably directional).
- Z‑Score: ~0.13.
Visual Orderflow Analysis via chart
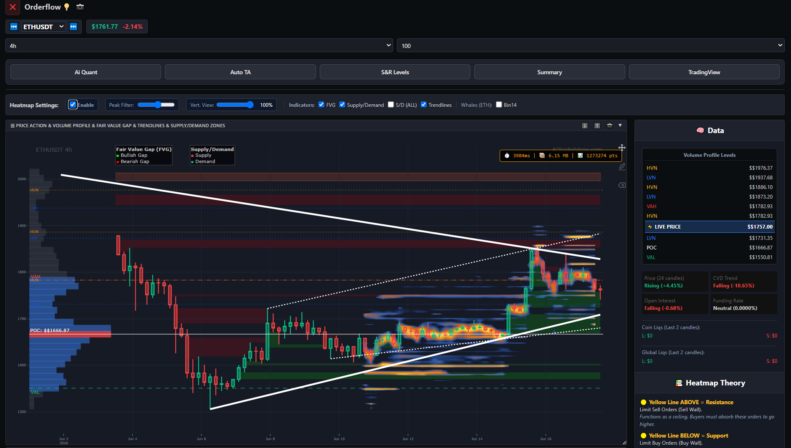
Examining the attached chart provides visual context for the numerical data. On the 4H chart price action is confined between two converging white trendlines forming a large consolidation triangle. Price is testing the lower edge of this triangle near the live price of $1,757.00. The Volume Profile on the chart highlights key levels:
- HVN (High Volume Nodes): $1,976.37, $1,937.68, $1,886.10; direct resistance at $1,782.93.
- POC (Point of Control): $1,666.87.
- LVN (Low Volume Node): near current price at $1,731.35.
- VAL (Value Area Low): $1,550.81.
Side statistics on the chart show that over the last 24 candles price was slightly up (-4.45% from the local top), but CVD Trend (Cumulative Volume Delta) fell -10.65%. Open Interest also decreased -0.68%, indicating the recent rise was driven more by short covering than by aggressive buying.
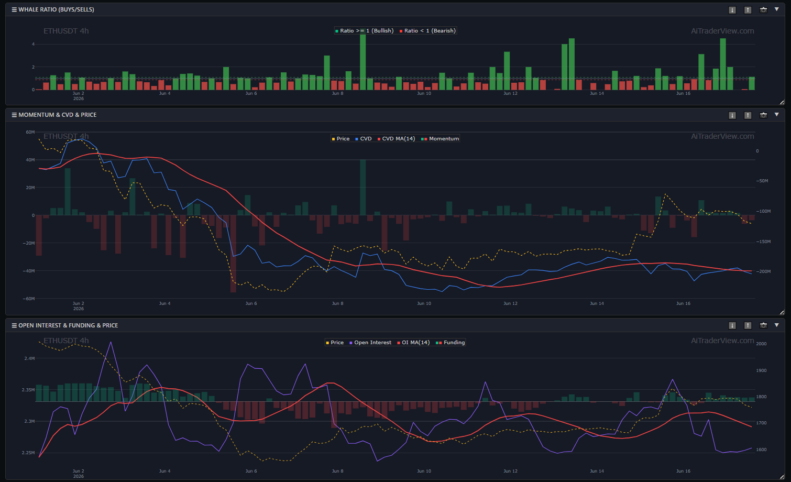
Another chart breaks this pattern into three subpanels. The top panel (Whale Ratio) shows large players became more active on June 16–17. The middle panel (Momentum & CVD & Price) shows the CVD line flattening around -200M, signaling steady selling pressure on futures (consistent with an ETH Perp CVD of -69.8M). The bottom panel (Open Interest & Funding & Price) shows a sharp drop in OI in recent days, pointing to capital outflows and possible long liquidations as price falls.
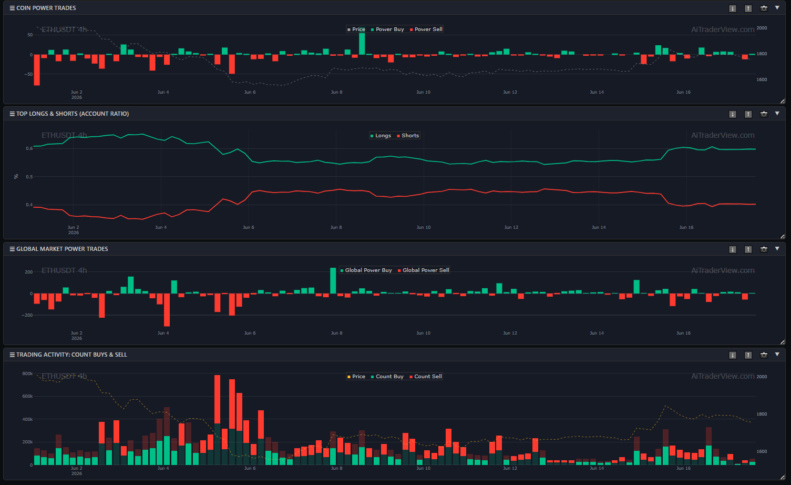
A third chart reveals market participation: the Top Longs & Shorts panel shows long positions dominate (green line ~60%–67%, shorts ~30%–40%), matching text stats where top accounts are 72.9% long. The Trading Activity panel shows buy/sell counts are much lower than during early‑June capitulation; current activity is stable but thin, leaving the market vulnerable to sudden volatility.
Medium and Long‑Term Analysis (1D and 1W Timeframes)
Zooming out to daily (1D) and weekly (1W) charts, the short‑term bullish hints fade into a clear bearish trend. On the daily chart the SMC (Smart Money Concepts) market structure is Bearish. Price sits below the daily Supertrend ($1,850.60, 🔴 Down). Daily RSI is weak at 44.94, CMF is negative (-0.0505), and MACD is deeply negative (-94.8625), though the histogram (-118.7422) shows a slight easing of downward momentum.
On the weekly chart the picture is even more concerning. There is an active Squeeze with strong upward momentum in that indicator, but the larger structure shows lower highs (LH) and lower lows (LL). Weekly RSI is near oversold at 32.95, and CCI is deeply oversold at -187.56. A weekly Break of Structure (Bear) occurred on June 1, 2026 around $1,747.80, validating the downtrend.
Fibonacci Levels and Resistances via chart
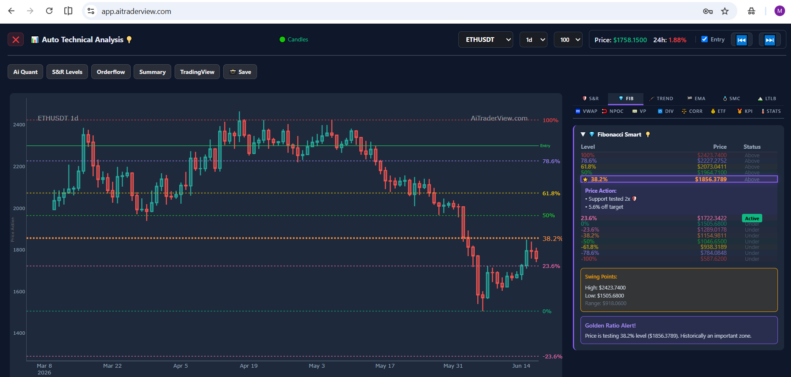
The daily chart with Fibonacci retracement drawn from the swing high $2,423.74 to swing low $1,505.68 shows Ethereum recently tested the 38.2% Fibonacci level at $1,856.38. The system’s “Golden Ratio Alert” flagged: “Price is testing 38.2% level ($1,856.3789). Historically an important zone.”
Price was strongly rejected there and is now moving back toward the 23.6% Fibonacci level ($1,722.34), currently marked as the active level. The daily chart shows price struggling to hold above weekly and daily support zones.
Classic support and resistance levels:
- Immediate support (s1): $1,757.00
- s2: $1,717.00
- s3: $1,676.00
- Immediate resistance (r1): $1,838.00
- r2: $1,879.00
- r3: $1,919.00
Daily EMAs confirm the bias: EMA 8 at $1,734.19, while longer EMAs (EMA 50 $1,962.03; EMA 100 $2,117.55; EMA 200 $2,384.94) sit well above price and slope downward.
Institutional Flows: The ETF Dashboard
A positive datapoint is the ETH ETF Dashboard on June 16, 2026. Ethereum recorded a net inflow (Net Flow) of +$9.6M, following +$22.5M on June 15. Despite a negative 7‑day cumulative total (– $12.6M) due to heavy outflows earlier that week (e.g., – $37.2M on June 10 and – $40.9M on June 9), Flow Acceleration rose +128.94%. The ETF trend signal is BULLISH with a buy recommendation (Score 6.5) based on attractive entry levels and recovering institutional demand.
Technical Forecast: Short‑Term Outlook
Based on the compiled statistics and chart visuals, we can outline a concrete short‑term forecast.
Why? (Rationale)
- Rejection at Crucial Resistance: Price was strongly rejected at the 38.2% Fibonacci resistance ($1,856.38), showing bears still control the larger trend on daily and weekly timeframes.
- Orderflow Pressure: Retail and whale accounts are largely long, but Open Interest falls sharply as price declines, suggesting a long squeeze where longs are forced to close. The negative 4H CVD (-10.65%) confirms active selling.
- Triangle Breakout: Price sits at the bottom of the consolidation triangle near $1,757. With rising USDT dominance and negative altcoin breadth (-0.03), a downward breakout is the most likely outcome.
- Liquidity Targets: An open daily Fair Value Gap (Bull) sits around $1,732.28 and the active 23.6% Fib level at $1,722.34. Price will likely seek this liquidity; if broken, the path opens to the 4H POC at $1,666.87.
Price Expectation for the Coming Days
The expectation is for further correction. If immediate support at $1,757 breaks, price should test the zone $1,732 (daily FVG) to $1,722 (23.6% Fib). Continued selling and weakness in traditional markets (Nasdaq) could lead to a retest of the POC around $1,663–$1,666. Only a decisive reclaim of the $1,782 HVN zone would temporarily ease bearish momentum.
Bullish / Bearish Sentiment Ratio
- Bullish: 35%
- Bearish: 65%
Try the analysis yourself — free with AITradeView
Discover how to run the same in‑depth Ethereum analysis on your own with AiTraderView.com. The platform scans macro indicators, on‑chain metrics, orderflow and technical charts, automatically highlights key levels (Fibonacci, POC, HVN/LVN), and produces clear visual orderflow insights — all in a few clicks. It’s ideal for traders who want to learn how signals form, test scenarios, and build confidence without doing every calculation by hand.
How to start: create a free account, load a chart, and let the tool generate a full technical summary and liquidity targets in seconds.
Note: This is for educational purposes only and not financial advice. Combine the tool’s output with your own research or professional guidance.
⚠️ RISK WARNING & AI DISCLOSURE
- This information is generated by Artificial Intelligence (AI) and complex algorithms. While advanced, these systems can contain errors or inaccuracies and are for educational purposes only.
- Technical analysis provides no guarantees; this information is purely informative.
- All discussed scenarios are hypothetical and do not constitute predictions or expectations.
- Past performance is not an indicator of future results.
- This is not financial advice and is not intended as a call-to-action for the reader.
- No implicit direction is claimed, and no specific behavior of market participants is suggested.