


Bitcoin (BTC) is currently trading around $65,500, but warning signs are accumulating behind the scenes. Looking beyond the spot price into order flow and market structure reveals a clear pattern. Several advanced technical indicators point to an imminent short-term correction. In this analysis we examine the data suggesting that bears are in control right now.
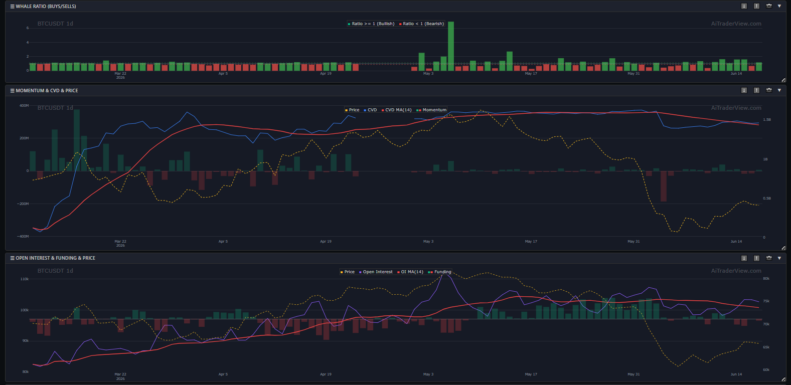
Falling CVD and Rising Open Interest One of the most concerning short-term signals comes from order flow data. The Cumulative Volume Delta (CVD) shows a sharp downward trend of roughly -8%, indicating that aggressive market orders are being dominated by sellers. At the same time Open Interest (OI) is ticking up slightly (+1.35%). A falling CVD together with rising OI is a classic bearish setup: it suggests traders are actively opening new short positions to speculate on a price decline.
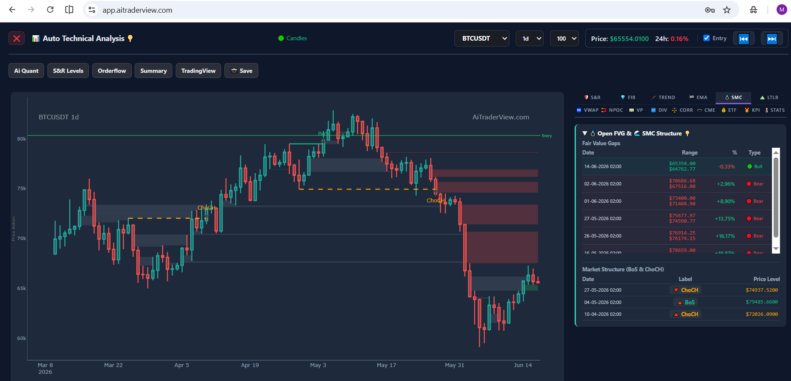
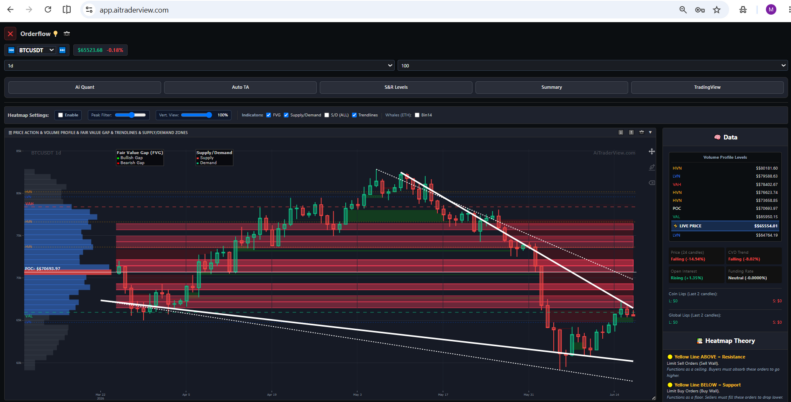
Heavy Resistance and Bearish Market Structure From a broader Smart Money Concepts (SMC) perspective, the trend shift is painfully clear. A Change of Character (ChoCH) to the downside was recently confirmed. Above the current price lie massive Supply Zones and multiple Bearish Fair Value Gaps (FVGs). The Point of Control (POC) — the price level with the highest historical traded volume — sits much higher at $70,693, acting as a significant ceiling. Buyers would need to push through a wall of sell orders to reverse the trend, which looks unlikely given the current lack of momentum.
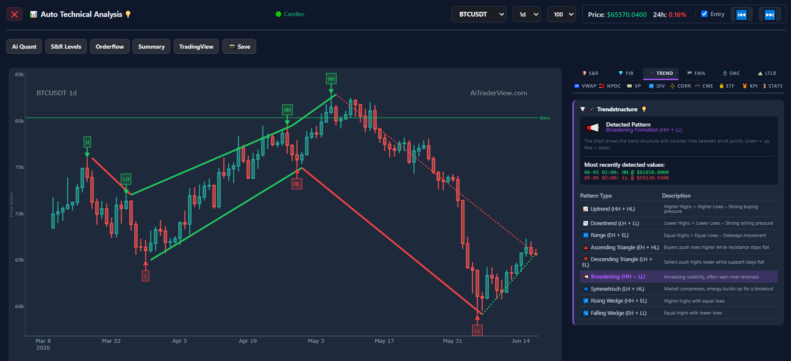
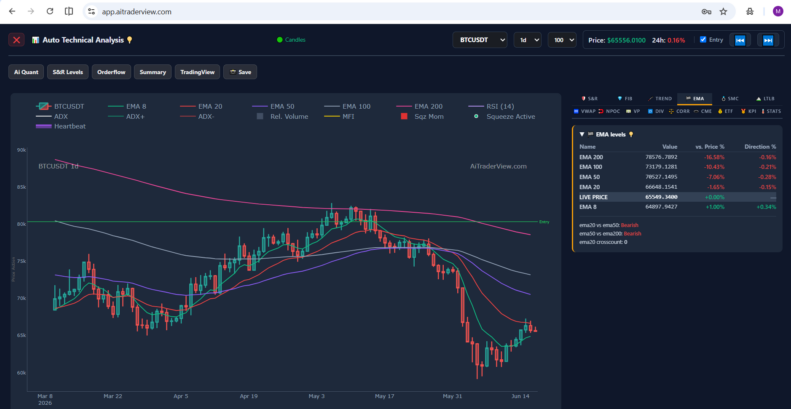
Trapped Below the EMAs Traditional technical analysis also supports the correction thesis. Bitcoin has been rejected and is trading below all major Exponential Moving Averages (EMAs), including the 20, 50, 100 and even the 200 EMA. As long as price remains under these moving averages, the overall trend is simply downward. Charts also show a Broadening Formation with a recent Lower Low (LL).
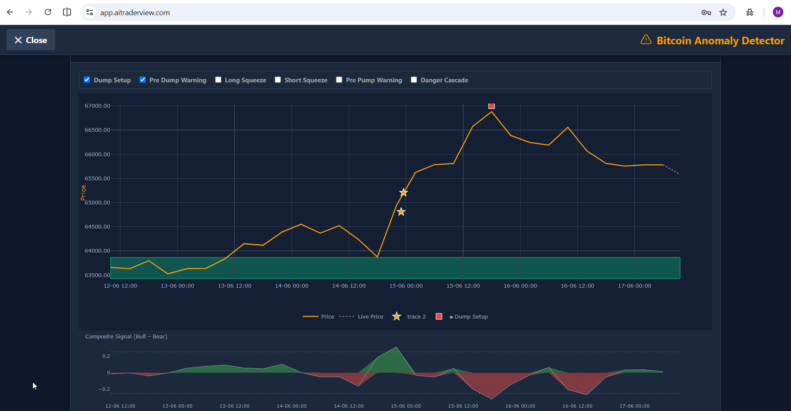
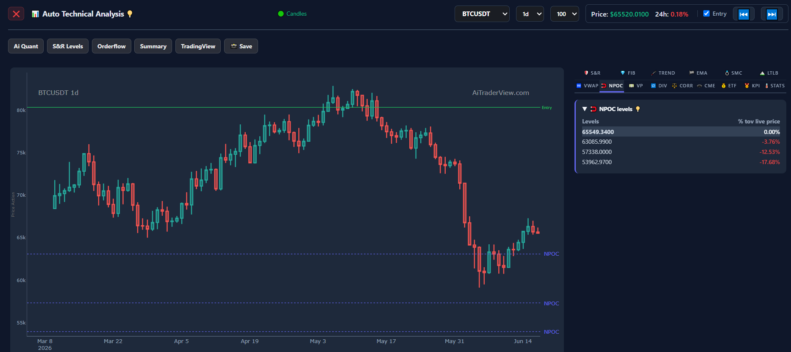
Anomalies and Price Magnets (NPOC) Perhaps the most striking signals come from the Anomaly Detector. Just before the price began to weaken, the system flagged a clear Dump Setup. Composite signals turned strongly bearish. If price continues lower, the heatmap highlights important Naked Point of Control (NPOC) levels that remain untested at $63,085 and further down at $57,338. In crypto markets these untested liquidity levels often act as strong magnets for price.
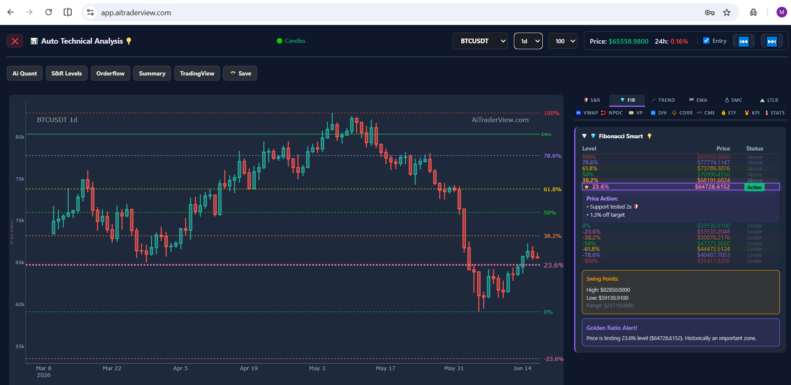
Conclusion: Critical Support at Risk Bitcoin is currently testing the 23.6% Fibonacci support around $64,728. That level has held the price twice already, but with persistent selling pressure (CVD), a rising number of shorts (OI), and heavy resistance overhead, it’s likely only a matter of time before it breaks. Traders should prepare for a retest of lower liquidity zones, with the $63,000 area the first logical target for the expected correction.
⚠️ RISK WARNING & AI DISCLOSURE
- This information is generated by Artificial Intelligence (AI) and complex algorithms. While advanced, these systems can contain errors or inaccuracies and are for educational purposes only.
- Technical analysis provides no guarantees; this information is purely informative.
- All discussed scenarios are hypothetical and do not constitute predictions or expectations.
- Past performance is not an indicator of future results.
- This is not financial advice and is not intended as a call-to-action for the reader.
- No implicit direction is claimed, and no specific behavior of market participants is suggested.