
Here’s a full read of both the daily and 4-hour charts across every indicator panel.
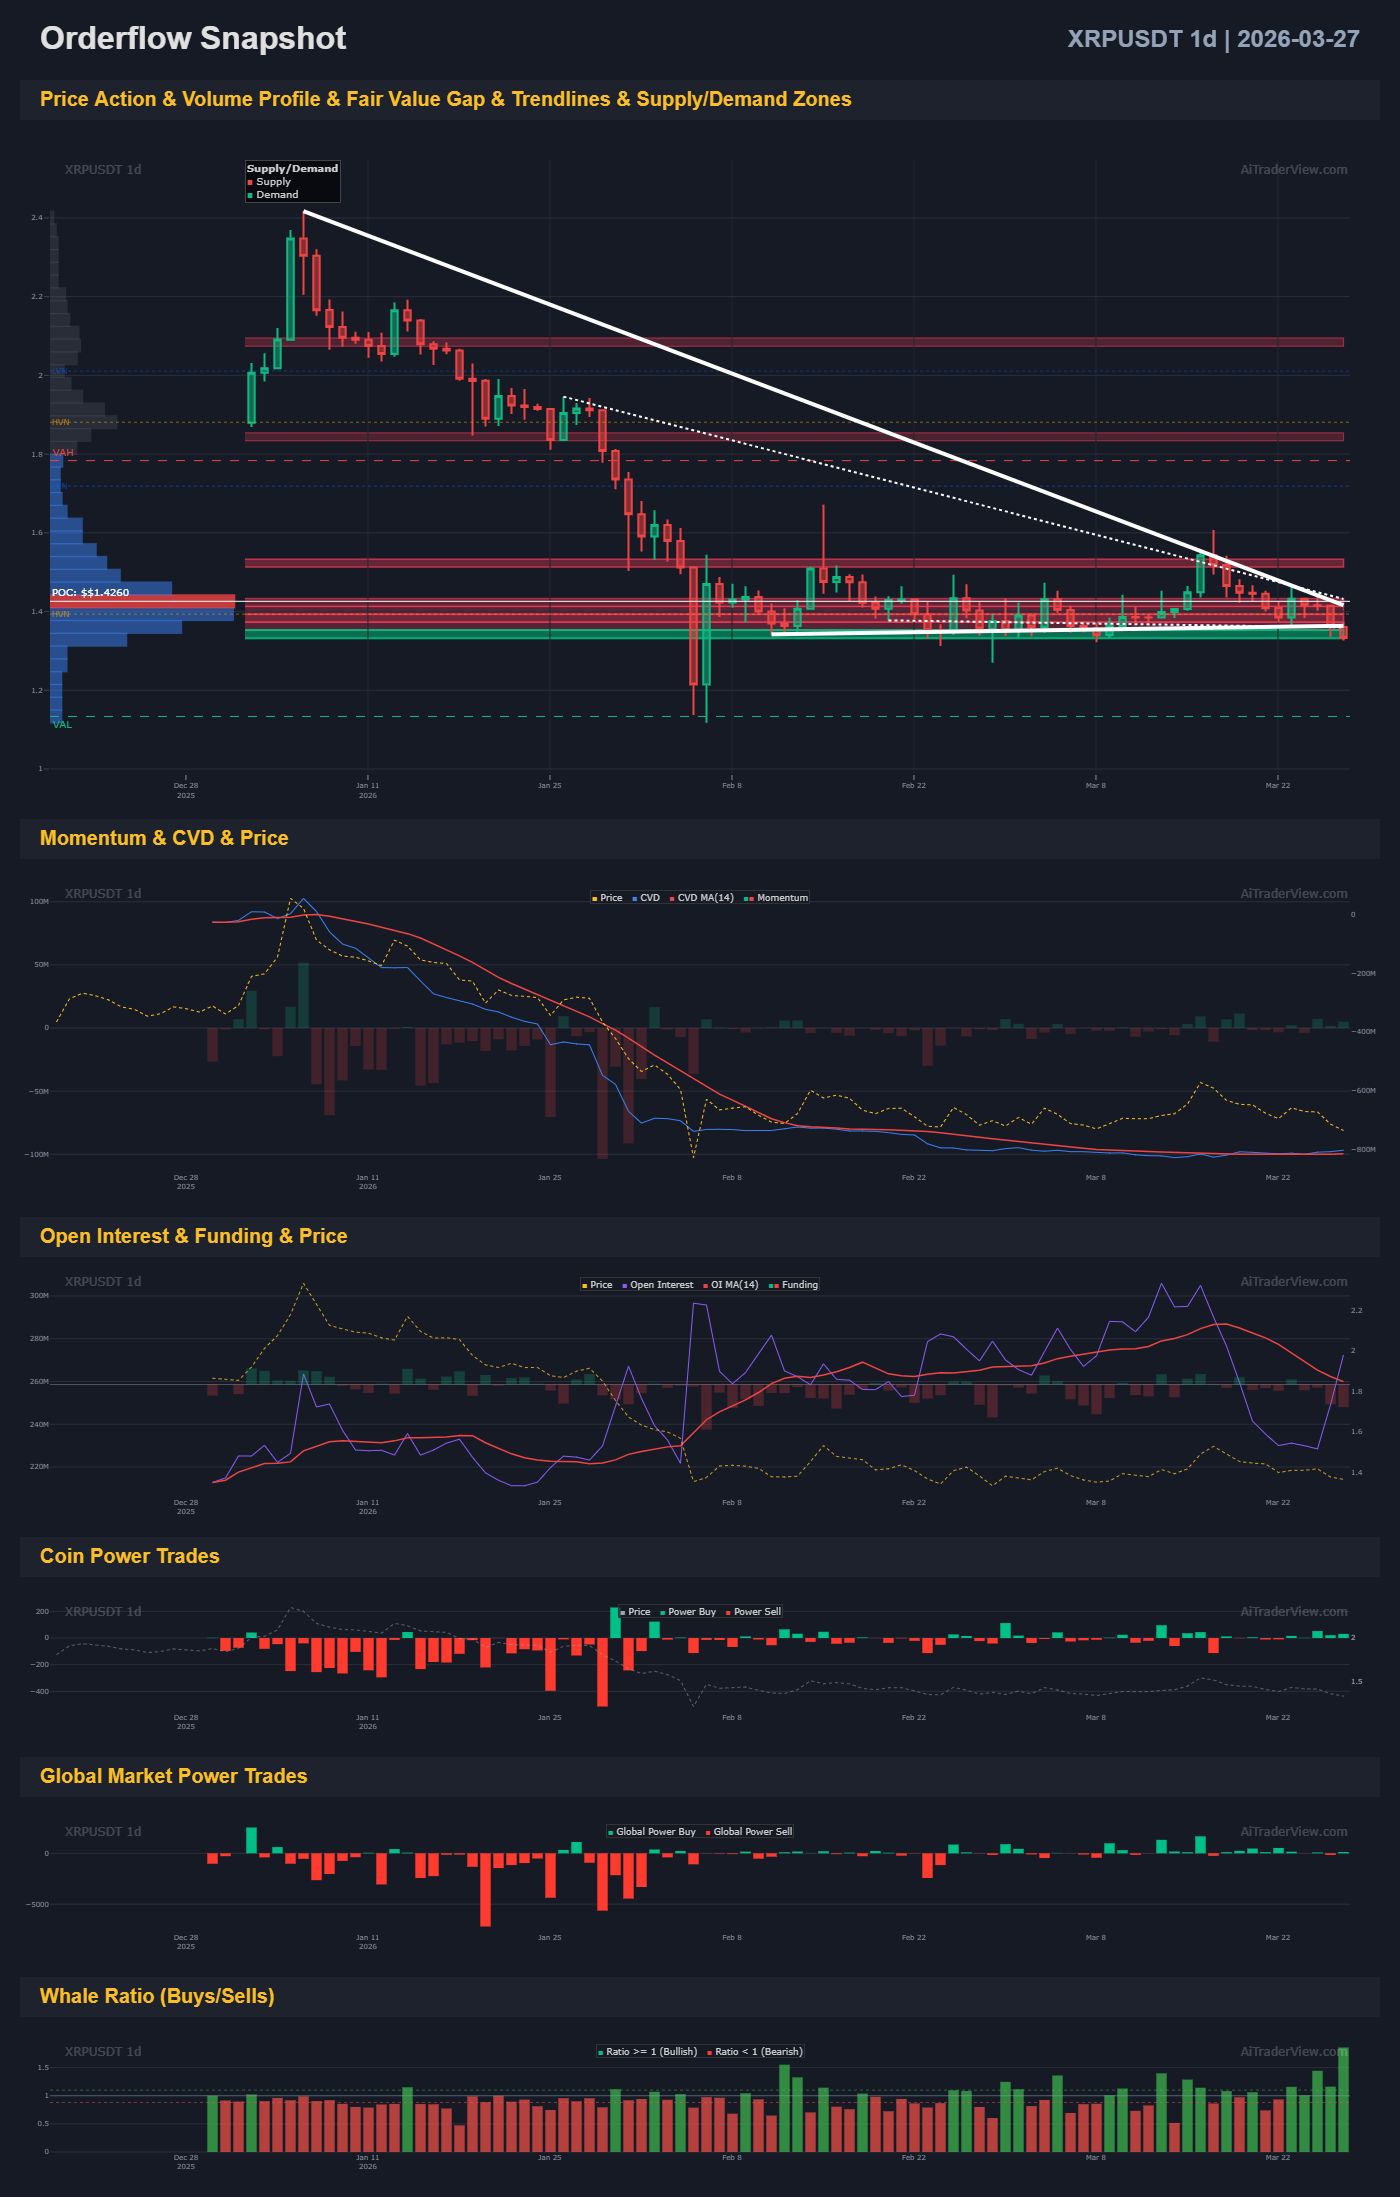
Daily (1D) — The Macro Picture
Price Action & Structure
XRP has been in a clear descending wedge since its peak near $3.40 in late December 2025. The converging trendlines (solid resistance, dotted support) are nearly at their apex, meaning a directional resolution is imminent. Price is currently compressing around the $2.00–2.10 demand zone cluster, sitting just above a heavy supply stack. The Point of Control (POC) at $1.4260 — the highest volume node — sits well below current price, suggesting price could gravitate there if demand fails. Multiple overlapping red supply zones above (~$2.20, $2.60, $3.00) will act as strong overhead resistance on any bounce.
Momentum & CVD
The Cumulative Volume Delta (CVD) has been declining steadily since the January peak, confirming persistent net selling pressure. The CVD MA(14) is still trending downward with no clear curl. Momentum bars have been predominantly red, though the far right shows slight flattening — a potential early sign of exhaustion in selling, but not yet a reversal signal.
Open Interest & Funding
OI was rising through late December/January alongside price (bullish confluence), but has since fallen sharply and is now showing a modest uptick. Funding rates have been mostly negative during the downtrend, indicating bearish positioning dominance. A rising OI with negative funding is a bearish setup unless it reverses quickly.
Coin Power Trades
Power Sell signals have dominated the entire period. There are a few isolated green Power Buy spikes in the most recent sessions, which could indicate early accumulation attempts — but volume is insufficient to confirm a trend shift.
Global Market Power Trades
Macro-level participants have been net sellers. Global Power Sell bars have been consistent and sizable. Very recently the bars are smaller and more mixed — global selling pressure may be moderating.
Whale Ratio (Buys/Sells)
This is the most encouraging signal on the daily. The whale ratio has been skewing increasingly bullish (green bars, ratio ≥ 1) in recent sessions, suggesting large participants are beginning to accumulate at these levels. This diverges from the still-bearish price action — a classic early accumulation signal worth watching.
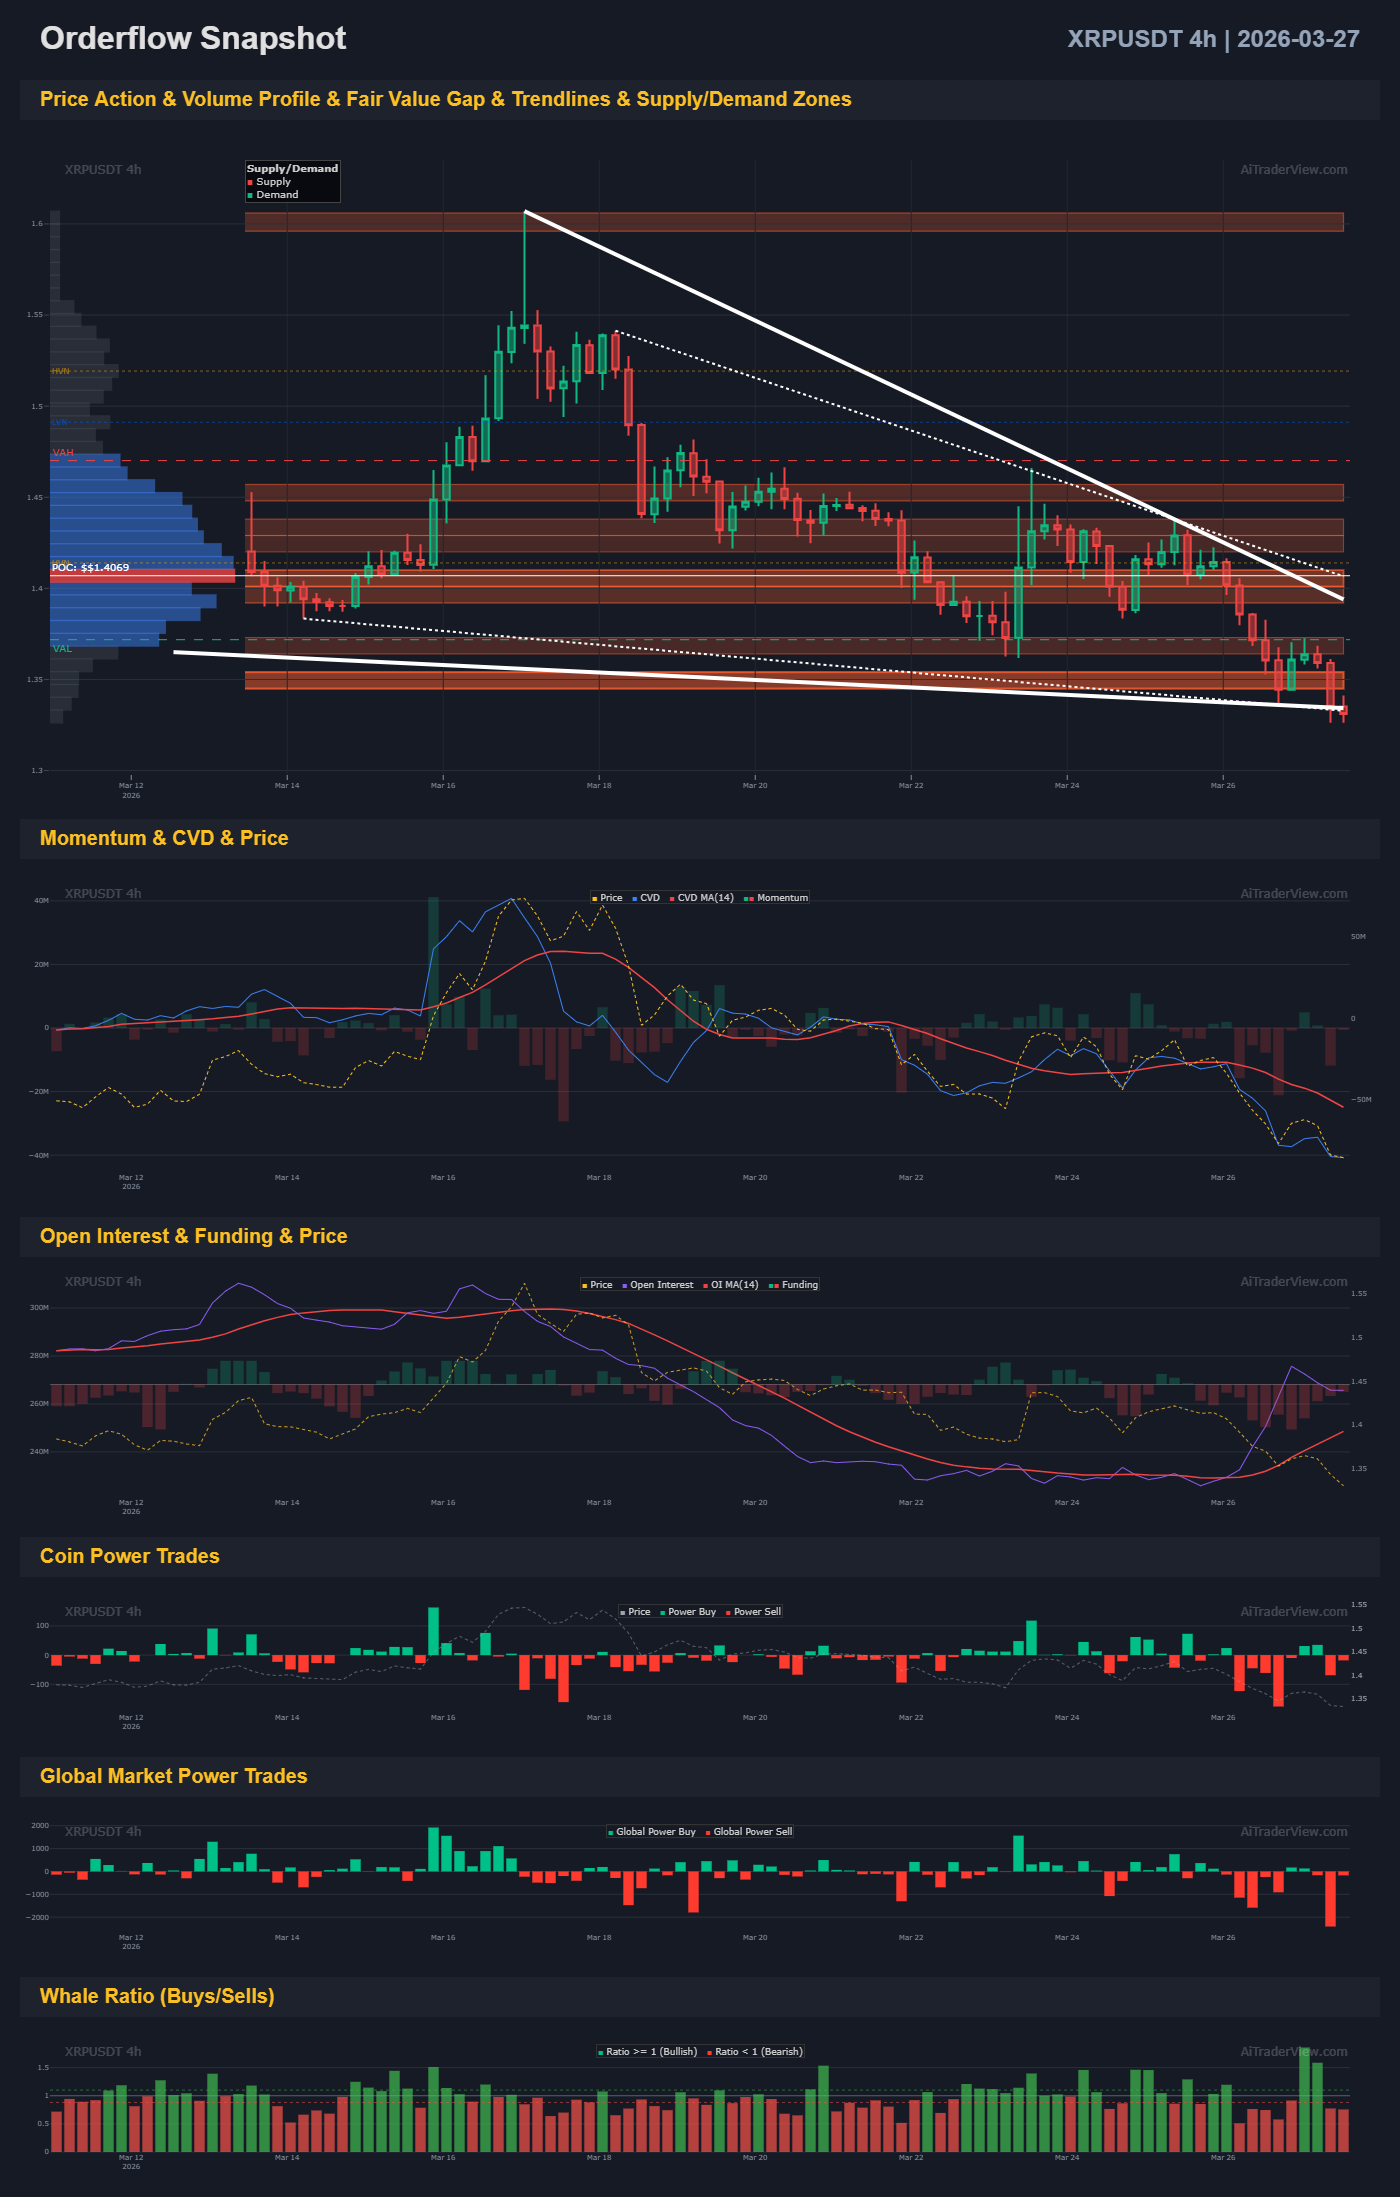
4-Hour (4H) — The Micro Structure
Price Action & Structure
The 4H shows the same descending wedge but with much more granularity. Price recently broke below an important support confluence around $1.40–1.45 and is pushing into fresh lows near $1.20–1.25 as of March 26–27. The POC here is $1.4069. A large demand zone (orange/brown) is visible below current price — this is a high-liquidity zone that may attract a reaction. The pattern is approaching the wedge’s lower boundary, suggesting either a bounce from demand or a full breakdown.
Momentum & CVD (4H)
CVD on the 4H is collapsing sharply, with the most recent candles showing the steepest CVD drop in the observed window. This confirms aggressive net selling at the current breakdown level. Momentum bars are deeply red. There is no divergence yet — price and CVD are falling in sync, which is bearish continuation.
Open Interest & Funding (4H)
OI is declining as price drops — this suggests longs are being liquidated rather than shorts being added, which is a classic long squeeze. Funding has turned negative. A falling OI + falling price = deleveraging event, not fresh short accumulation, which can resolve quickly once liquidations clear.
Coin Power Trades (4H)
Heavy Power Sell signals in the most recent sessions. Some Power Buy signals visible but overwhelmed by sell-side flow. No sustained buying pressure confirmed.
Global Market Power Trades (4H)
Large Global Power Sell bars dominate the final sessions — notably spiking right at the point of the recent breakdown. This suggests coordinated or macro-driven selling, not just retail panic.
Whale Ratio (4H)
Unlike the daily which was showing improving whale buy ratios, the 4H whale ratio is skewing red (bearish) in the most recent candles. This means whales are selling on the short-term timeframe even if they’re accumulating on the daily — a bifurcated signal that often means “distribution into longer-term accumulation zones.”
Synthesis & Key Takeaways
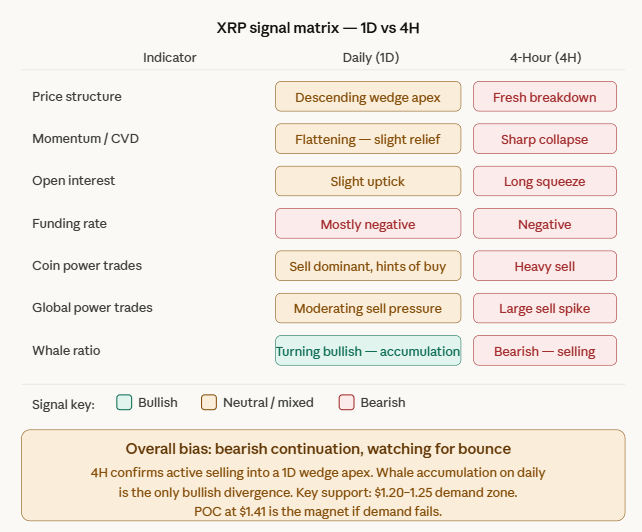
Bottom line: The 4H is clearly bearish — fresh breakdown, collapsing CVD, and heavy global sell-side flow. The daily is more nuanced: the wedge is at its apex, and whale accumulation is showing up — but that alone doesn’t flip the trend. The most important levels to watch are the $1.20–1.25 demand zone (immediate support on the 4H) and the $1.41 POC (the highest-volume gravitational level). A decisive bounce with increasing buy-side power and CVD curl on the 4H would be the first sign of a potential reversal. Until then, the path of least resistance remains lower.
This is technical analysis for informational purposes only and does not constitute financial advice. Always do your own research.
⚠️ RISK WARNING & AI DISCLOSURE
- This information is generated by Artificial Intelligence (AI) and complex algorithms. While advanced, these systems can contain errors or inaccuracies and are for educational purposes only.
- Technical analysis provides no guarantees; this information is purely informative.
- All discussed scenarios are hypothetical and do not constitute predictions or expectations.
- Past performance is not an indicator of future results.
- This is not financial advice and is not intended as a call-to-action for the reader.
- No implicit direction is claimed, and no specific behavior of market participants is suggested.